
Market Analysis
The cryptocurrency market continues to experience a high level of uncertainty. While there are some signs of modest improvement, the overall trend still reflects caution and pressure. Complexities in the global economy have unsettled investor confidence, resulting in a lack of a clear directional movement within the crypto space.
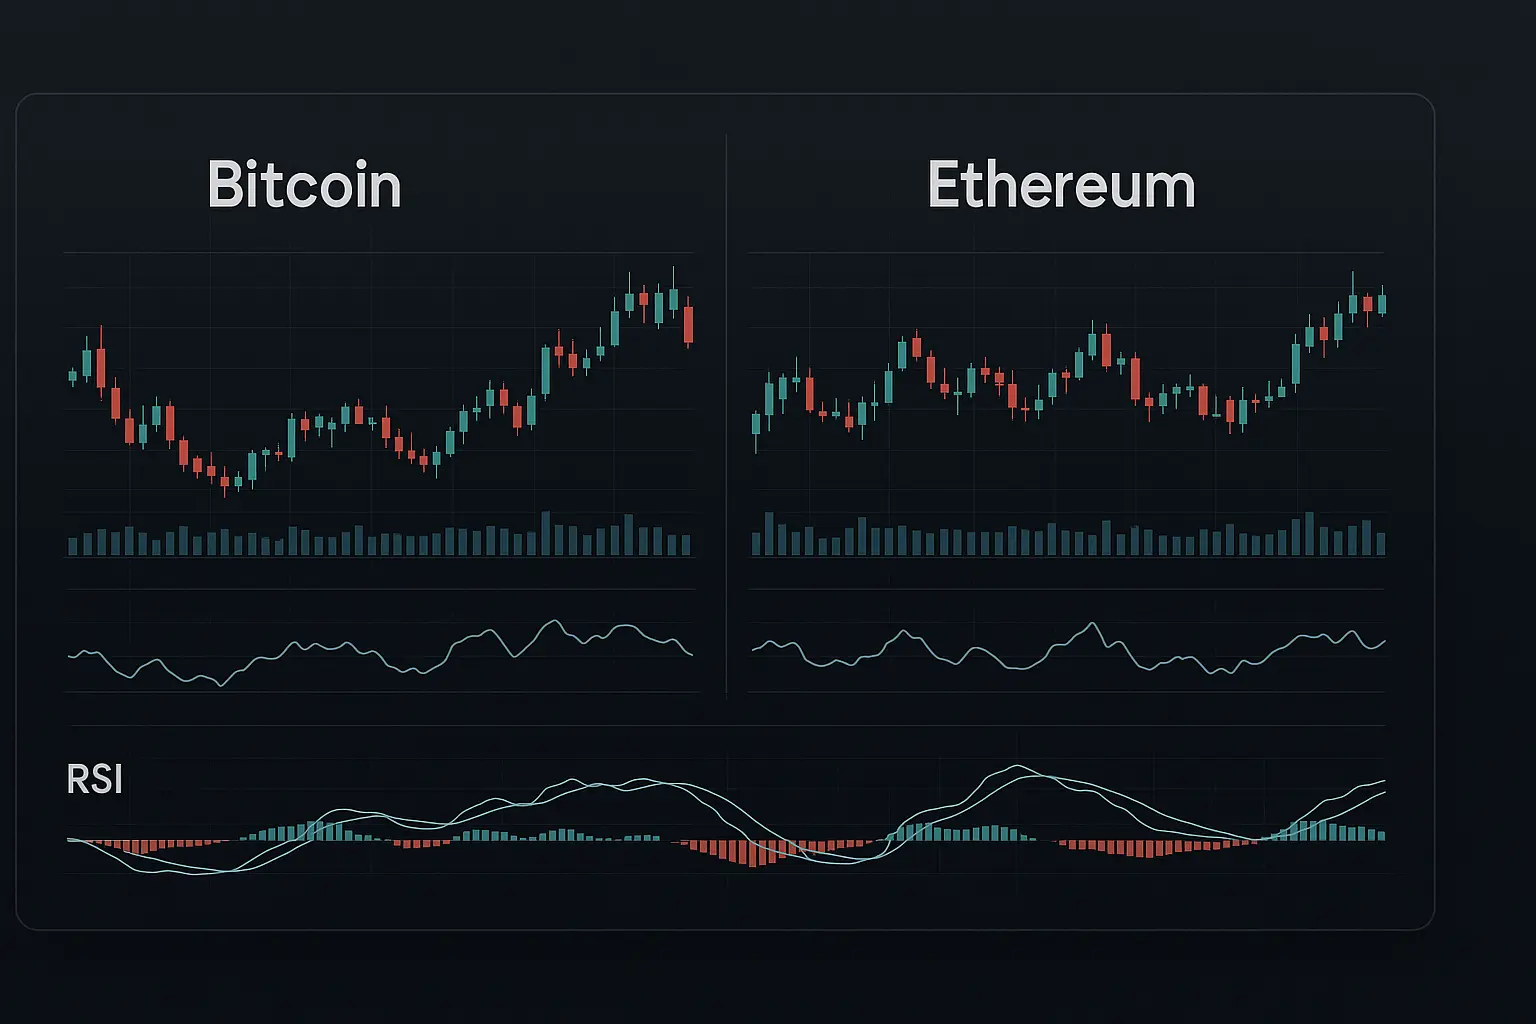
Over the past five days, Bitcoin’s price has shown significant volatility, impacting both technical indicators and market sentiment. On December 11, Bitcoin started at 92,015 and reached a peak of 93,555, but subsequently declined to 86,432 by December 15. During this period, the 7-day Relative Strength Index (RSI) dropped from 58.12 to 29.24, signaling weakening momentum. Similarly, the 14-day Money Flow Index (MFI) decreased from 58.4 to around 51, indicating moderation in financial inflows. The Fear & Greed Index has fallen sharply to 16, reflecting extreme fear among investors, though not yet at a level that suggests an imminent market reversal.
Bollinger Bands analysis shows that the price recently touched the lower band, suggesting the market may have entered an oversold zone. However, the band’s width has not expanded significantly, highlighting ongoing uncertainty and relatively subdued price movements. The 7-day Hull Moving Average (HMA) has been declining steadily and stood at 86,654 on December 15, tracking closely with the downward price trend. Meanwhile, the 50- and 100-day moving averages remain below the current price, offering weak but consistent support. The 200-day moving average is positioned at 95,186—well above the current price—indicating that the long-term trend is still under pressure.
In terms of support and resistance, Bitcoin recently tested the S1 support zone between 84,739 and 83,111, a critical area for market stability. If this support fails to hold, the next key support level lies between 82,715 and 80,818 (S2), which could signal further downside risk. On the resistance front, the immediate challenge is within the R1 range of 86,845 to 87,078, with stronger resistance at R2 spanning 90,375 to 93,555, representing recent highs. The psychological barrier of 90,000 also poses a significant hurdle, unlikely to be easily surpassed in the near term.
Looking at the broader context, ongoing global economic uncertainties—especially rising inflation and political tensions in the US and Europe—have fostered a cautious investor mindset. Uncertainty around economic policies, including those potentially emerging in a second Trump administration, continues to influence the crypto market. Although there has been a slight increase in funding rates and a modest 0.9% rise in open interest, indicating some investor engagement, overall market sentiment remains tilted toward fear. Reduced trading volumes and transaction counts further demonstrate that investors are hesitant to take large positions at this time.
The current MACD (Moving Average Convergence Divergence) setup also confirms market weakness. The narrowing gap between the MACD line and the signal line suggests a potential for continued downward movement. However, should Bitcoin’s price manage to break above the 86,845 resistance range, it could trigger a short-term rally, especially if the RSI and MFI indicators improve. Presently, no strong bullish signals are apparent, though modest positive reactions may occur in the short run.
Overall, considering Bitcoin’s technical condition alongside global economic factors, the market is dominated by indecision and downward pressure. Despite slight price recoveries, fear continues to weigh heavily on investors. A breach of key support levels could lead to further declines, whereas stabilizing above 86,845 accompanied by increased volume might offer some short-term recovery potential. Given the global economic and political uncertainties, a cautious approach remains advisable, as the market remains vulnerable to sudden and sharp movements. Investors are encouraged to develop strategies that incorporate both technical data and fundamental developments.
Data Summary
- 1. Time:
2025-12-16 – 00:00 UTC - 2. Prices:
Open: 88172.16000000High: 90052.64000000Low: 85146.64000000Close: 86432.08000000
- 8. Supports:
S1: 84739.74000000 – 83111.64000000S2: 82715.03000000 – 80818.84000000S3: 78595.86000000 – 76322.42000000S4: 69310.5 – 68842.2
- 9. Resistances:
R1: 86845.94000000 – 87078.46000000R2: 90375.20000000 – 93555.00000000R3: 96887.14000000 – 98345.00000000R4: 101110 – 101732
- 10. Psychological Support:
80000.00000000
- 11. Psychological Resistance:
90000.00000000
- 3. Last 5 days’ closing prices:
2025-12-11: 92513.380000002025-12-12: 90268.420000002025-12-13: 90240.010000002025-12-14: 88172.170000002025-12-15: 86432.08000000
- 4. Volume:
BTC: 19778.6919USD: $1732823429.5017
- 5. Number of trades:
6747167
- 6. Indicators:
RSI: 29.2400MFI: 51.0100BB Upper: 94088.99000000BB Lower: 86504.31000000
- 7. Moving Averages:
SMA:7=90331.4600000014=90621.6100000021=90296.6500000030=89961.9500000050=95974.97000000100=105049.25000000200=108151.19000000EMA:
7=89314.1800000014=90058.6100000021=90794.4900000030=92139.4000000050=95461.44000000100=100864.87000000200=102692.28000000HMA:
7=86654.8000000014=89548.3800000021=90328.2400000030=90999.8300000050=88022.96000000100=85597.02000000200=95186.34000000 - 12. Funding Rate:
0.0031% (Technically Positive)
- 13. Open Interest:
88545.9150
- 14. Fear & Greed Index:
16 (Extreme Fear)
Disclaimer: This market analysis is generated by AI based on historical BTC data and sentiment indicators. Use it as a reference, not financial advice.
