
Market Analysis
The market is showing some positive movements today; however, the overall trend remains uncertain and fragile. Global economic complexities have dampened investor sentiment, resulting in a steady but limited rise in Bitcoin’s price.
An analysis of data from the past five days reveals that despite price fluctuations, the market has yet to experience a clear breakout, with technical indicators sending mixed signals. Between November 24 and 28, Bitcoin’s price oscillated between 85,272 and 93,092, indicating a market balance hovering between bearish and neutral zones. Weak readings from the Relative Strength Index (RSI) and Money Flow Index (MFI) suggest limited buying momentum, while a narrowing of the Bollinger Bands points to price consolidation and reduced volatility.
Delving deeper into technical and sentiment factors helps clarify the current landscape.
Bitcoin opened at 86,830 on November 24 and closed at 90,890 on November 28, marking a modest gain. Despite this, prices remain below the 50- and 100-day moving averages, signaling a prevailing long-term bearish trend. The 7-day Hull Moving Average (HMA) has been steadily rising, reflecting some short-term positive momentum; yet, with the 50- and 100-day moving averages still well above current prices, the likelihood of a full bullish breakout remains low.
The 7-day RSI has fluctuated between 35 and 51, pointing toward weak to neutral buying strength. Notably, on November 24 and 25, the RSI hovered in the low 30s, indicative of a weak zone, before improving slightly to near 50 by November 27 and 28. However, it remains far from overbought or strong buying levels. Similarly, the 14-day MFI ranged between 12 and 28, suggesting limited capital inflow and subdued buying activity. Together, these indicators imply that most investors are exercising caution and refraining from significant purchases.
Examining the 21-day Bollinger Bands, the midline is around 93,826, with the upper band near 106,843 and the lower band close to 80,808. Bitcoin’s price has largely moved between the lower and middle bands, indicating stability within a narrow range. The bands have notably contracted, further signaling low volatility and potential consolidation. A decisive move above the midline could spark a short-term uptrend, but downward pressure may persist if prices cannot sustain gains above this level.
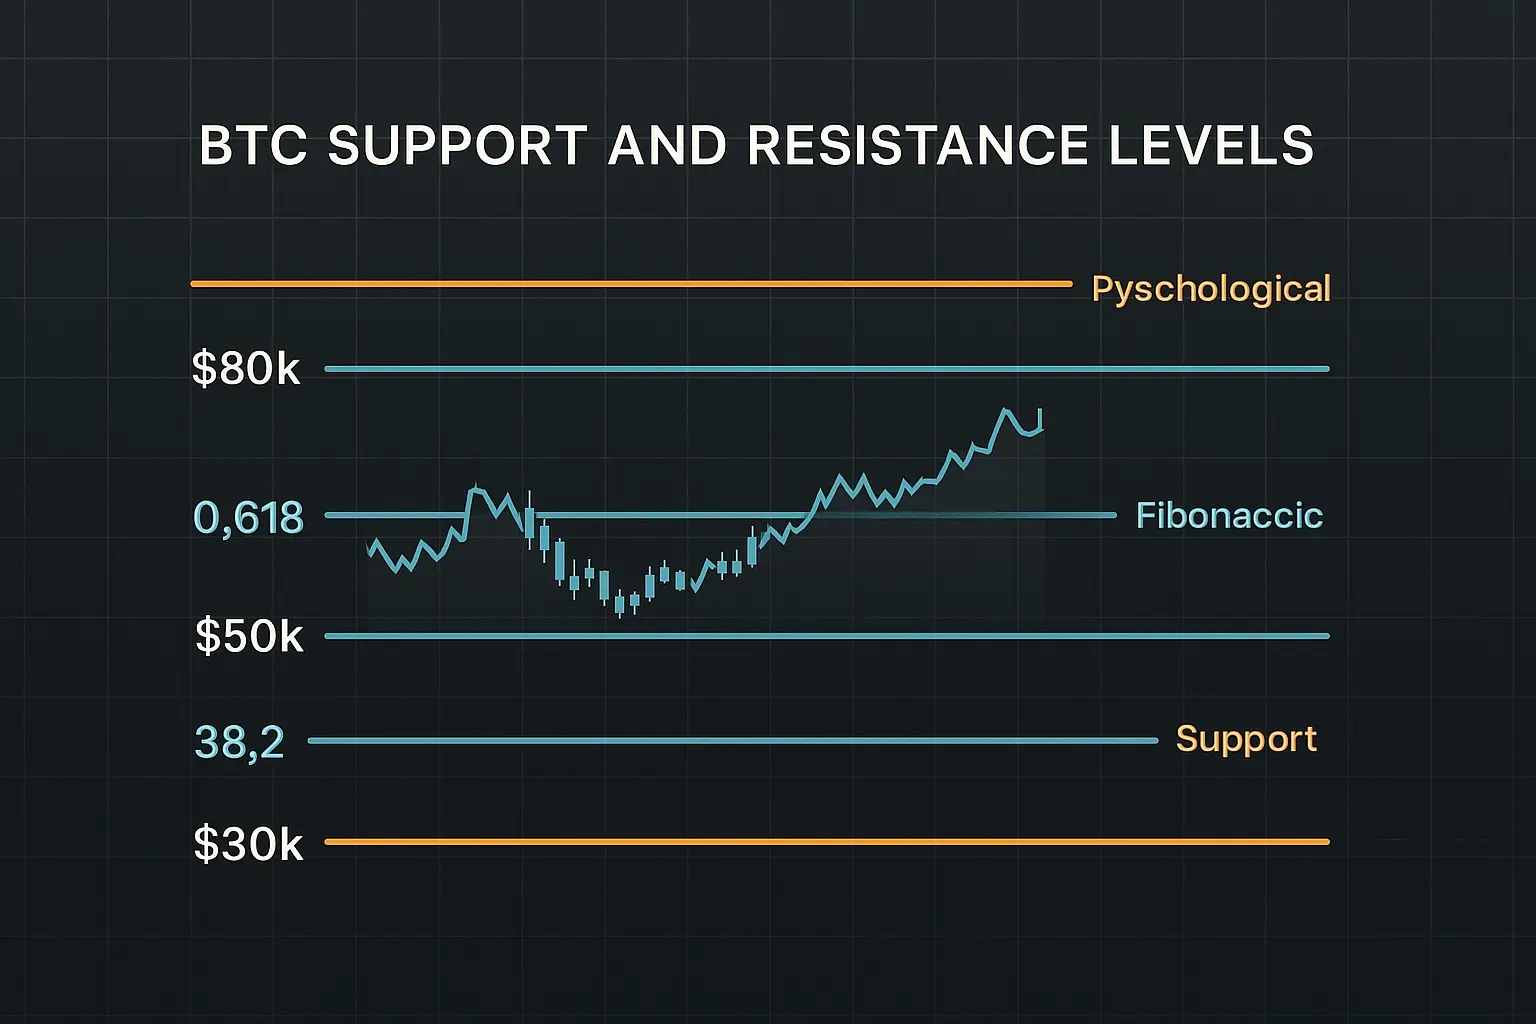
Regarding support and resistance, the closing price on November 28 at 90,890 sits near the S1 support zone between 89,855 and 87,952, while resistance lies between 91,032 and 91,950 (R1). This tight range leaves room for either a breakout or breakdown. A fall below 89,855 would bring the next major support between 87,369 and 85,800 into focus, potentially intensifying bearish pressure. Conversely, a breakout above 91,950 could open the path toward resistance in the 94,270 to 95,461 range. Psychological levels at 90,000 (support) and 100,000 (resistance) remain key thresholds that could influence price direction.
The Fear and Greed Index has hovered between 15 and 25 over the last five days, edging close to extreme fear but not fully reaching it. This reflects prevailing market anxiety, with investors adopting a cautious stance and avoiding large-scale purchases. The funding rate remains negative, and open interest has seen a slight uptick, signaling continued presence of short positions. This environment supports a bearish outlook, though recent positive price movements suggest some potential for short-term gains.
On the news front, global economic uncertainty and financial strains across various countries have exerted downward pressure on the crypto market. The Federal Reserve’s steady interest rate stance and challenges within the European Union’s fiscal policies have dampened investor confidence. Additionally, tighter cryptocurrency regulations in China and other Asian nations have added to the market’s strain. Collectively, these factors pose long-term challenges, resulting in Bitcoin’s steady yet limited price appreciation.
In summary, Bitcoin is navigating a complex and uncertain phase. While short-term indicators such as the 7-day HMA and modest price increases point to some positive signals, longer-term moving averages, along with subdued RSI and MFI readings, suggest a market leaning toward neutral to bearish sentiment. Elevated fear levels and global economic uncertainties could increase selling pressure, but stable support levels offer a chance for short-term reversal. Investors are advised to adopt a cautious approach, carefully weighing both technical and fundamental factors, and remain prepared for significant market shifts.
Data Summary
- 1. Time:
2025-11-29 – 00:00 UTC - 2. Prices:
Open: 91333.94000000High: 93092.00000000Low: 90180.63000000Close: 90890.70000000
- 8. Supports:
S1: 89855.99000000 – 87952.01000000S2: 87369.96000000 – 85800.00000000S3: 84474.69000000 – 83949.52000000S4: 78595.9 – 76322.4
- 9. Resistances:
R1: 91032.07000000 – 91950.00000000R2: 94270.00000000 – 95461.53000000R3: 97430.82000000 – 98826.00000000R4: 103262 – 104550
- 10. Psychological Support:
90000.00000000
- 11. Psychological Resistance:
100000.00000000
- 3. Last 5 days’ closing prices:
2025-11-24: 88300.010000002025-11-25: 87369.960000002025-11-26: 90484.020000002025-11-27: 91333.950000002025-11-28: 90890.70000000
- 4. Volume:
BTC: 18830.8601USD: $1721418035.0796
- 5. Number of trades:
4229754
- 6. Indicators:
RSI: 49.5400MFI: 28.8500BB Upper: 106843.62000000BB Lower: 80808.77000000
- 7. Moving Averages:
SMA:7=88564.0500000014=89878.8300000021=93826.1900000030=97519.0100000050=102881.45000000100=108661.31000000200=109372.86000000EMA:
7=89811.0900000014=91278.9600000021=93532.0100000030=96205.3000000050=100507.23000000100=105132.89000000200=104980.37000000HMA:
7=92193.8900000014=89068.8200000021=85804.3400000030=84604.9400000050=86585.91000000100=93804.65000000200=103872.91000000 - 12. Funding Rate:
-0.0017% (Technically Positive)
- 13. Open Interest:
90207.0050
- 14. Fear & Greed Index:
25 (Extreme Fear)
Disclaimer: This market analysis is generated by AI based on historical BTC data and sentiment indicators. Use it as a reference, not financial advice.
