
Market Analysis
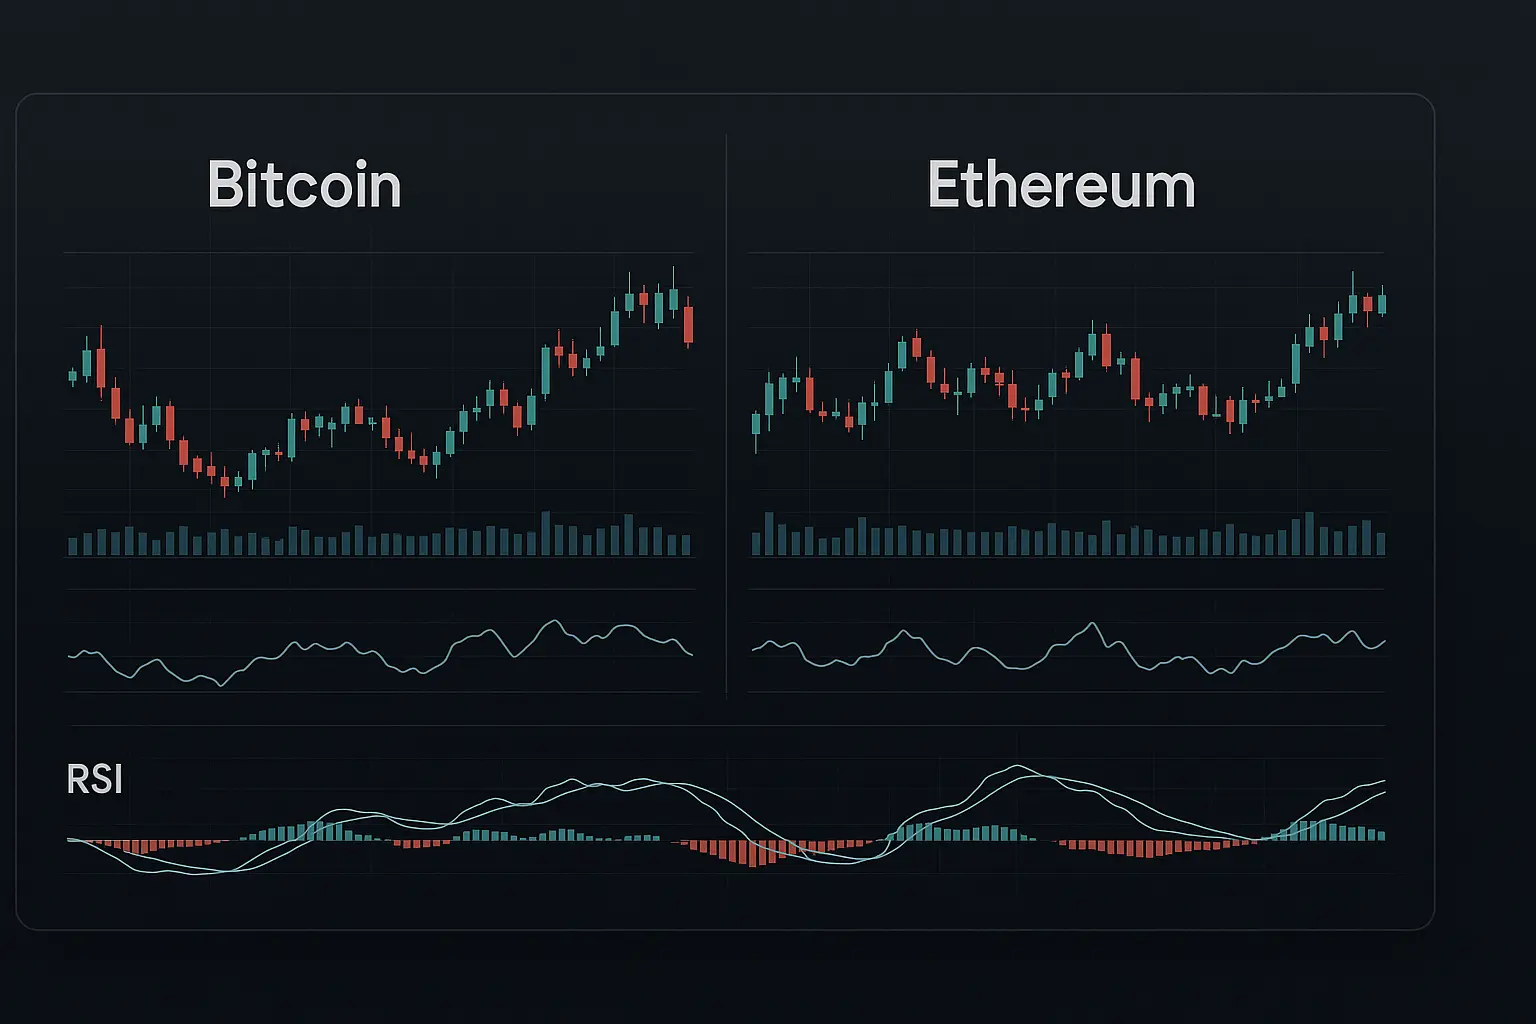
Bitcoin’s price recently reached a peak near 124,000 but has since shown clear signs of weakness. Despite a cut in the Federal Reserve’s interest rates, the market failed to respond positively, leading to increased caution and anxiety among investors. Today, we will conduct a detailed review of the current technical indicators and market sentiment to better understand potential future trends.
An analysis of the last five days reveals a significant decline in Bitcoin’s value, starting from 92,960 on November 19 and dropping to 85,129 by November 21. Both the Relative Strength Index (RSI) and the Money Flow Index (MFI) have fallen below 20, signaling a heavily oversold market. The continued downward trend in RSI alongside weak MFI levels indicates subdued buying power and prevailing bearish sentiment. Additionally, the Fear and Greed Index remains in extreme fear territory, fluctuating between 11 and 15, reflecting growing investor distrust and unease.
Turning to the Bollinger Bands, the price is currently near the lower band, identifying a crucial support zone. However, a narrowing of the bands suggests decreased volatility and a likely period of consolidation. The moving averages offer a similarly bleak outlook: the 7-, 14-, and 21-day Hull Moving Averages are steadily declining, with the latest closing price below these averages, reinforcing the downtrend. Although there was some price recovery on November 23, it was undermined by a noticeable drop in trading volume and activity, weakening the bullish momentum.
Regarding support and resistance levels, Bitcoin is presently trading within the S1 range of 84,739 to 83,111—a key support area. Should this level break, the next significant support zone lies between 82,715 and 80,818 (S2), which could be critical if the price continues downward. On the upside, resistance has been encountered recently in the R1 range of 86,845 to 87,078, followed by a stronger resistance zone marked by the R2 range of 90,375 to 93,265. Psychological levels at 80,000 (support) and 90,000 (resistance) also play an important role in market behavior. Heightened fear intensifies the importance of these support levels, as any breach could trigger a rapid decline.
In the context of recent news, Bitcoin’s inability to stabilize despite the Fed’s rate cut reflects prevailing bearish investor sentiment. Most media reports reinforce the negative outlook, prompting even long-term investors to adopt a cautious stance. Funding rates remain negative, and open interest has seen a slight increase, indicating a rise in short positions. This context points to a potential for further short-term declines, although a rebound at key support levels remains possible over the longer term.
Overall, the current technical and sentiment landscape for Bitcoin appears discouraging, with clear signs of short-term weakness. Yet, the extreme oversold conditions and elevated fear levels suggest that the market may be poised for some degree of reversal. Investors should closely monitor support zones and avoid hasty decisions amid ongoing uncertainty. Continuous observation of market sentiment and technical indicators will be essential for anticipating future price movements.
Data Summary
- 1. Time:
2025-11-24 – 00:00 UTC - 2. Prices:
Open: 84739.75000000High: 88127.64000000Low: 84667.57000000Close: 86830.00000000
- 8. Supports:
S1: 84739.74000000 – 83111.64000000S2: 82715.03000000 – 80818.84000000S3: 78595.86000000 – 76322.42000000
- 9. Resistances:
R1: 86845.94000000 – 87078.46000000R2: 90375.20000000 – 93265.64000000R3: 96887.14000000 – 98345.00000000R4: 103262 – 104550
- 10. Psychological Support:
80000.00000000
- 11. Psychological Resistance:
90000.00000000
- 3. Last 5 days’ closing prices:
2025-11-19: 91554.960000002025-11-20: 86637.230000002025-11-21: 85129.430000002025-11-22: 84739.740000002025-11-23: 86830.00000000
- 4. Volume:
BTC: 19734.4642USD: $1708685030.2799
- 5. Number of trades:
5063493
- 6. Indicators:
RSI: 27.0700MFI: 12.7200BB Upper: 111146.88000000BB Lower: 83007.59000000
- 7. Moving Averages:
SMA:7=88581.0500000014=93923.9700000021=97077.2400000030=101347.4900000050=106202.72000000100=110049.66000000200=109523.91000000EMA:
7=88660.3300000014=92686.8800000021=95781.1200000030=98741.6800000050=102889.57000000100=106754.75000000200=105764.12000000HMA:
7=83835.2600000014=84283.3400000021=84815.1700000030=87546.2200000050=91652.21000000100=98912.32000000200=107116.88000000 - 12. Funding Rate:
-0.0009% (Technically Positive)
- 13. Open Interest:
98862.4350
- 14. Fear & Greed Index:
13 (Extreme Fear)
Disclaimer: This market analysis is generated by AI based on historical BTC data and sentiment indicators. Use it as a reference, not financial advice.
