
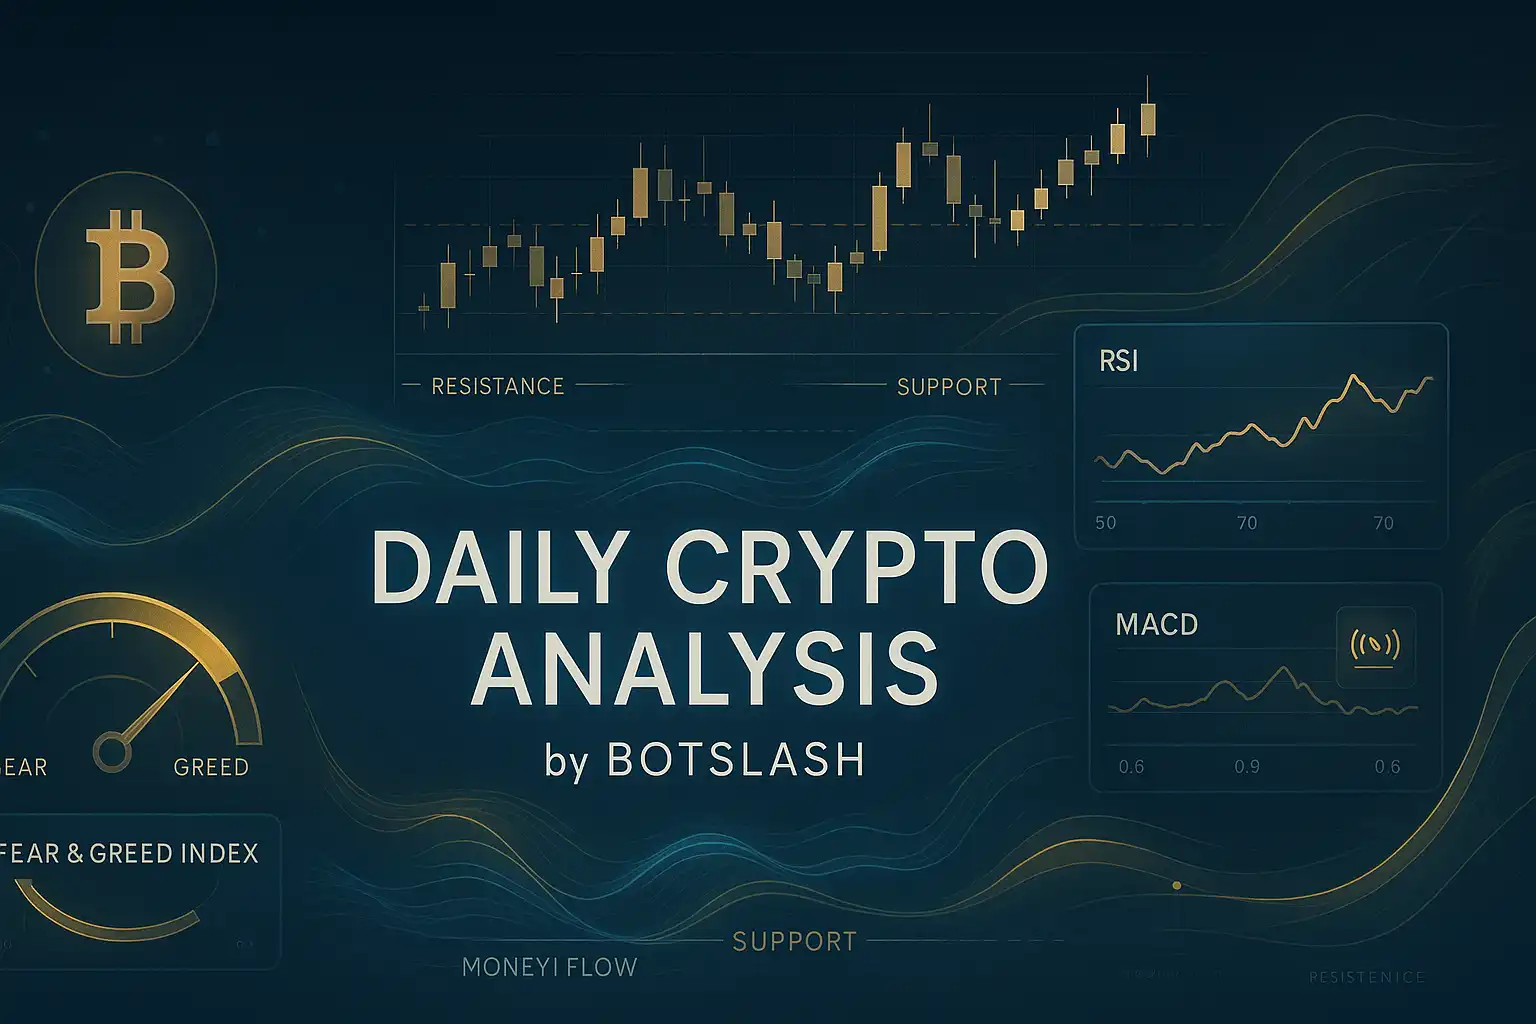
Market Analysis
Bitcoin recently attempted to surpass the significant milestone of 124,000 but was unable to sustain momentum, leading to increased uncertainty in the market. Despite the Federal Reserve's decision to lower interest rates, investor enthusiasm remains subdued, suggesting that price pressure may persist in the near term.
Over the past five days, Bitcoin has exhibited notable weakness, with prices consistently trending downward and key indicators such as the RSI (Relative Strength Index) and MFI (Money Flow Index) lingering in weak zones. On November 14, the price dropped sharply from 99,692 to close at 94,594, signaling substantial bearish sentiment. At that time, the RSI stood at 22.13 and the MFI at 28.42, levels close to oversold conditions but not fully into that territory. In the following days, the RSI remained between 20 and 30, indicating sustained but not extreme downward pressure. Market sentiment is dominated by fear, as reflected by the Fear & Greed Index fluctuating between 10 and 16—an indication of intense apprehension. This heightened concern underscores the importance of key support levels, particularly the psychological support near 90,000, which currently sits close to the market price.
Looking at moving averages, the 7-day, 14-day, and 21-day Hull Moving Averages (HMA) have all been steadily declining, reinforcing the bearish trend. On November 18, the 7-day HMA was at 91,475, while the closing price was slightly above it at 92,960. Although the price remains just above this moving average, the persistent downward slope of all HMAs points to ongoing market weakness. Bollinger Bands show the price hovering near the lower band, which can sometimes signal a potential rebound or indicate a weak market phase; however, accompanying low trading volume suggests any bounce is likely to be fragile.
The financing rate is positive but minimal, and open interest has increased by 2.66%, hinting at some degree of market engagement. Nevertheless, diminished trading volume and fewer transactions have further contributed to the prevailing weakness. Market reports also corroborate that despite the Fed’s rate cuts, investors are cautious due to global economic uncertainties and other financial headwinds, which have dampened overall market enthusiasm. Under these circumstances, short-term downward pressure on Bitcoin appears likely, making it crucial to monitor support levels closely in case of a sudden reversal.
In summary, Bitcoin’s current technical and sentiment indicators point to a fragile market environment with the price hovering near the critical psychological support at 90,000. Should this support fail, the next likely targets are 87,325 and 84,474. Conversely, if the price manages to close above the 94,270 to 95,461 range, a temporary recovery could be expected. However, there is no clear indication of a strong upward trend at this time. Investors are advised to avoid impulsive decisions and pay close attention to technical signals and support zones to better gauge the market’s direction.
Data Summary
- 1. Time:
2025-11-19 – 00:00 UTC - 2. Prices:
Open: 92215.14000000High: 93836.01000000Low: 89253.78000000Close: 92960.83000000
- 8. Supports:
S1: 92792.05000000 – 91203.67000000S2: 87325.59000000 – 86310.00000000S3: 84474.69000000 – 83949.52000000S4: 78595.9 – 76322.4
- 9. Resistances:
R1: 94270.00000000 – 95461.53000000R2: 96887.14000000 – 98345.00000000R3: 103261.60000000 – 104550.33000000R4: 105858 – 106457
- 10. Psychological Support:
90000.00000000
- 11. Psychological Resistance:
100000.00000000
- 3. Last 5 days’ closing prices:
2025-11-14: 94594.000000002025-11-15: 95596.240000002025-11-16: 94261.440000002025-11-17: 92215.140000002025-11-18: 92960.83000000
- 4. Volume:
BTC: 39835.1477USD: $3641033186.3005
- 5. Number of trades:
8786593
- 6. Indicators:
RSI: 25.6100MFI: 22.4000BB Upper: 113922.83000000BB Lower: 91060.18000000
- 7. Moving Averages:
SMA:7=95853.4300000014=99689.3100000021=102491.5000000030=105100.4500000050=109466.08000000100=111498.06000000200=109717.85000000EMA:
7=95712.9700000014=98958.2100000021=101278.5500000030=103454.5900000050=106432.45000000100=108839.45000000200=106728.46000000HMA:
7=91475.2400000014=92148.1700000021=93980.0100000030=95451.6300000050=98688.82000000100=104084.29000000200=109983.97000000 - 12. Funding Rate:
0.0037% (Technically Positive)
- 13. Open Interest:
101318.6710
- 14. Fear & Greed Index:
11 (Extreme Fear)
Disclaimer: This market analysis is generated by AI based on historical BTC data and sentiment indicators. Use it as a reference, not financial advice.
