
Market Analysis
Bitcoin recently faced a notable setback after reaching a peak near 124,000. Despite the Federal Reserve’s interest rate cuts, it has struggled to maintain its momentum. This has contributed to growing uncertainty in the market, prompting investors to adopt a cautious stance, which in turn is generating tension regarding the cryptocurrency’s future direction.
Examining Bitcoin’s technical condition and market sentiment over the past five days alongside recent news provides valuable insight into current trends and potential shifts. Bitcoin opened at 111,004.89 on October 24 and closed at 112,898.45 on October 28, reflecting a moderate but uncertain upward trend. The Relative Strength Index (RSI) with a 7-day period fluctuated between 51.44 and 55.22, signaling a market leaning slightly toward strength but remaining within neutral territory rather than entering overbought or oversold zones. Similarly, the Money Flow Index (MFI) for 14 days ranged from 48.01 to 54.14, indicating balanced liquidity and moderate trading activity. The Fear and Greed Index oscillated between 30 and 50 during this period, showing a shift from initial fear toward more neutral sentiment, yet still lacking full investor confidence.
Bollinger Bands analysis reveals that Bitcoin’s price stayed near the middle band and attempted to approach the upper band but failed to break through, suggesting limited volatility and a potential consolidation phase. Trading volume peaked on October 27 at approximately 21,450, signaling increased market activity that day, while a significant decline in volume on October 25 dampened buying enthusiasm.
Reviewing moving averages, the 7-day Hull Moving Average (HMA) hovered near 114,810, close to the current price, while the 14-, 21-, and 30-day moving averages pointed upward. However, the 50- and 100-day moving averages remained slightly above the price level, indicating some long-term selling pressure. Although the short-term trend appears positive, the narrowing gap between medium- and long-term averages suggests only a weak upward momentum.
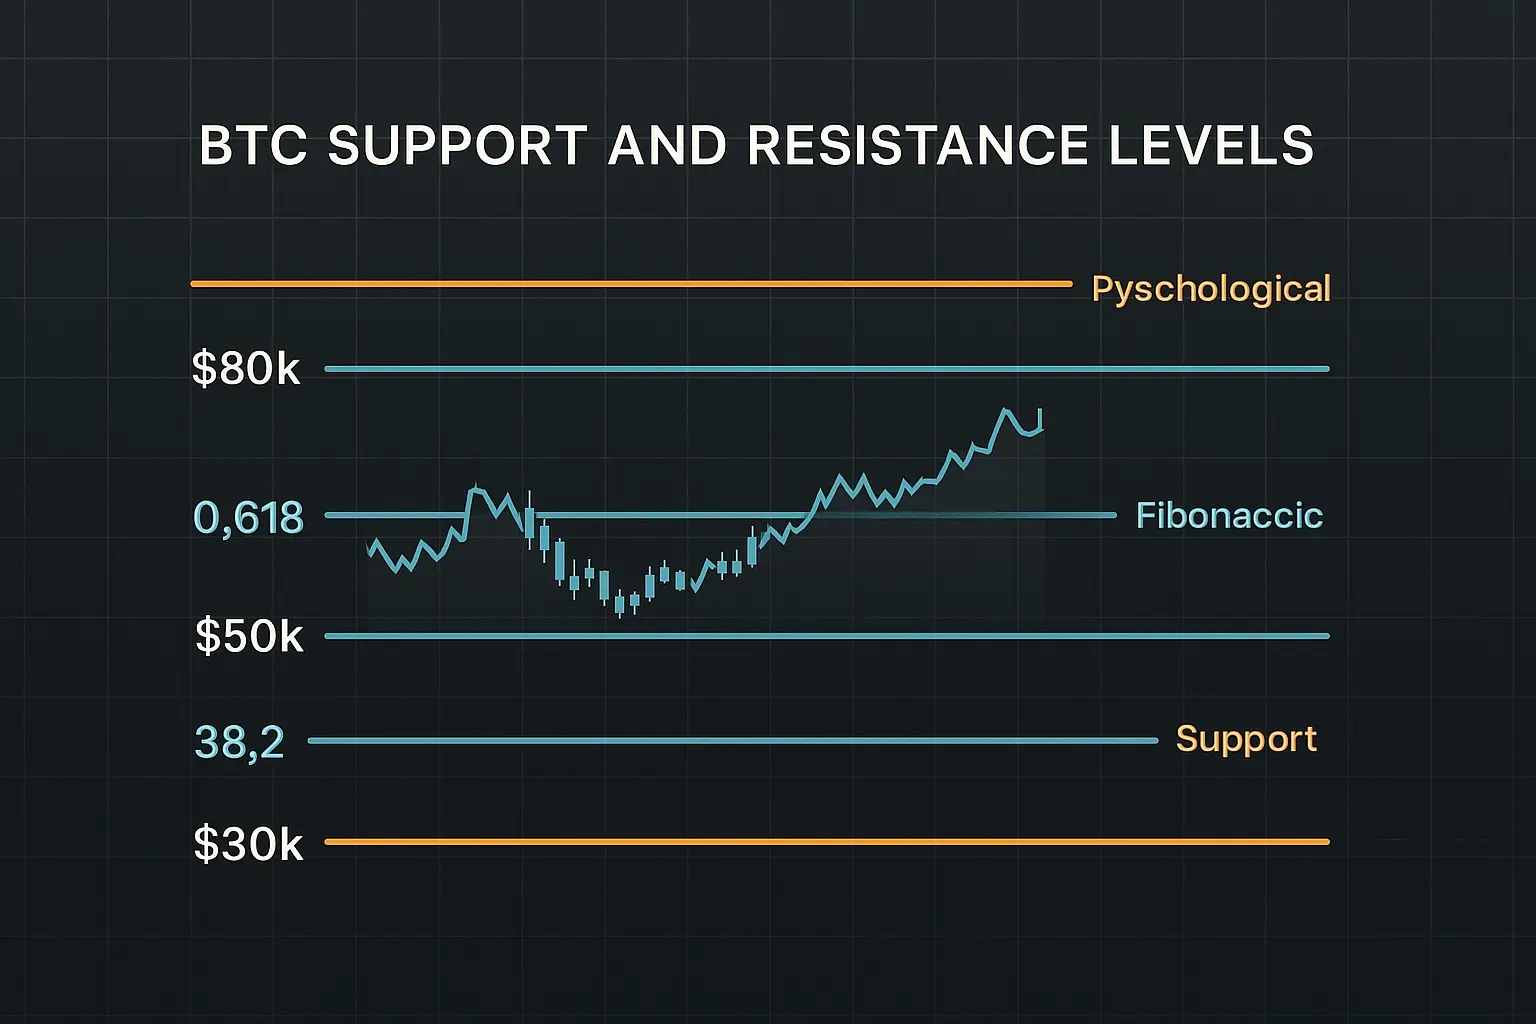
In terms of support, the range between 112,211 and 112,872 forms the nearest solid base just below current prices. If this level breaks, the next support zone lies between 107,172 and 108,377. The psychological support at 110,000 remains a key level for market confidence. On the resistance side, the area from 114,271 to 115,127 represents the closest barrier, with the 120,000 mark serving as another significant psychological hurdle. Should Bitcoin surpass the 115,000 level, the next major resistance to watch is 124,000.
Recent geopolitical developments have also influenced sentiment. A meeting between U.S. President Trump and Chinese President Xi Jinping fostered optimism across global markets, positively impacting Bitcoin’s price. Additionally, a decline in U.S. inflation rates has raised expectations of possible further Federal Reserve rate cuts, a factor generally favorable for cryptocurrencies. However, deviations from Bitcoin’s traditional four-year halving cycle have introduced investor concerns, adding to the current market uncertainty.
Furthermore, declines in both the funding rate and open interest reflect a cautious investor mindset, signaling reluctance to take on increased risk. While accumulation by large holders offers a constructive sign, diminished liquidity and subdued trading volumes limit the strength of this positive sentiment.
Overall, Bitcoin’s present technical and emotional landscape portrays a balanced yet cautious market environment. Despite a short-term upward trend, long-term pressures and lingering uncertainties persist. Investors are advised to pay close attention to key support and resistance levels and avoid hasty decisions without clear market signals. Staying prepared for sudden shifts and prioritizing risk management remain essential strategies in navigating this environment.
Data Summary
- 1. Time:
2025-10-29 – 00:00 UTC - 2. Prices:
Open: 114107.65000000High: 116086.00000000Low: 112211.00000000Close: 112898.45000000
- 8. Supports:
S1: 112872.94000000 – 112211.00000000S2: 108377.40000000 – 107172.52000000S3: 101508.68000000 – 99950.77000000S4: 96945.6 – 90056.2
- 9. Resistances:
R1: 114271.24000000 – 115127.81000000R2: 119177.56000000 – 121022.07000000R3: 123306.00000000 – 124197.25000000
- 10. Psychological Support:
110000.00000000
- 11. Psychological Resistance:
120000.00000000
- 3. Last 5 days’ closing prices:
2025-10-24: 111004.890000002025-10-25: 111646.270000002025-10-26: 114559.400000002025-10-27: 114107.650000002025-10-28: 112898.45000000
- 4. Volume:
BTC: 15523.4226USD: $1772753529.8643
- 5. Number of trades:
3829845
- 6. Indicators:
RSI: 55.2200MFI: 54.1400BB Upper: 120542.53000000BB Lower: 103595.50000000
- 7. Moving Averages:
SMA:7=111694.6100000014=110136.3600000021=112069.0100000030=114438.2100000050=114237.14000000100=114601.88000000200=107948.45000000EMA:
7=112226.9200000014=111951.3800000021=112343.2700000030=112805.9000000050=113289.31000000100=112483.52000000200=107792.38000000HMA:
7=114810.9900000014=113745.7000000021=111535.7200000030=108456.9000000050=110174.42000000100=113478.47000000200=116112.25000000 - 12. Funding Rate:
0.003% (Technically Positive)
- 13. Open Interest:
78019.1290
- 14. Fear & Greed Index:
50 (Neutral)
Disclaimer: This market analysis is generated by AI based on historical BTC data and sentiment indicators. Use it as a reference, not financial advice.
