
Market Analysis
Bitcoin has recently experienced significant price volatility, struggling to surpass the critical threshold of 124,000 despite a reduction in the Federal Reserve’s interest rates. The anticipated bullish momentum has yet to materialize fully, prompting a cautious approach as signs of potential price reversals become increasingly evident.
An analysis of the past five days reveals that Bitcoin’s price fluctuated within a range of 114,048 to 125,708. Several technical indicators and market sentiments shed light on the current dynamics. The Relative Strength Index (RSI) climbed from 72.58 to 81.99 over a seven-day period, nearing the overbought zone, which suggests strong upward momentum but also raises the risk of a price correction. Similarly, the Money Flow Index (MFI) rose from 38.53 to 63.66, reflecting increased liquidity and capital movement within the market. While this growth points to stronger investment activity, it also signals the need for vigilance.
Examining the Bollinger Bands shows that the price has frequently hovered near the upper band, indicating heightened volatility and bullish pressure. However, a noticeable drop in trading volume on October 4th tempered this momentum somewhat, increasing the possibility of a pause or pullback. The Hull Moving Averages (HMAs) for both 7 and 14 days have trended upwards, confirming a robust short- to medium-term uptrend.
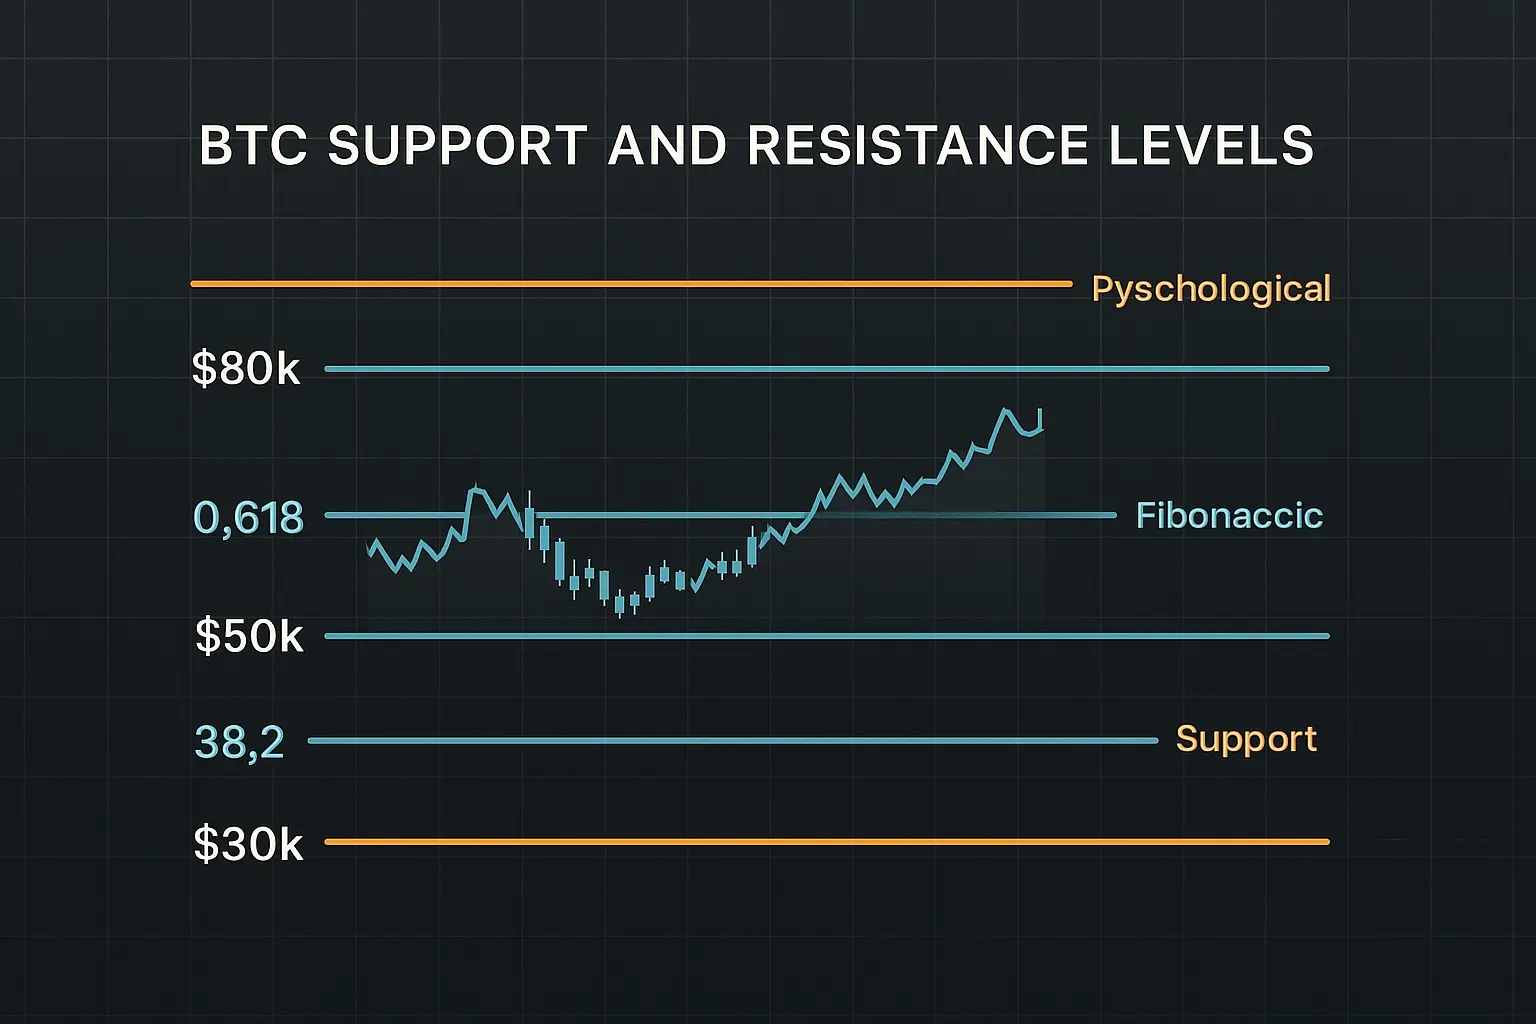
Support levels are established between 117,758 and 115,188, with a secondary support zone from 112,872 to 112,380. Should these levels fail to hold, a stronger support range lies between 101,509 and 99,950. On the resistance front, the psychological barrier at 125,000 remains critical—close to the recent all-time high—where Bitcoin has encountered difficulty advancing. Breaking this resistance could propel the price to new heights, whereas failure to do so may lead to a correction.
The Fear and Greed Index has surged from 49 to 74, indicating growing market greed. This heightened optimism often foreshadows short-term selling pressure, suggesting that a price pullback could be imminent. Market sentiment is mixed; while certain institutions predict further price increases, concerns stemming from the partial U.S. government shutdown and high-profile crypto fraud cases have instilled caution among investors.
Overall, despite the recent upward movement, technical signals and sentiment indicators advise prudence. Investors are encouraged to closely monitor key support and resistance levels and adopt risk management strategies to protect against sudden downturns. Given the current volatility and market developments, thorough research and analysis remain essential for those considering long-term positions in Bitcoin.
Data Summary
- 1. Time:
2025-10-06 – 00:00 UTC - 2. Prices:
Open: 122390.99000000High: 125708.42000000Low: 122136.00000000Close: 123482.31000000
- 8. Supports:
S1: 117758.09000000 – 115188.00000000S2: 112872.94000000 – 112380.00000000S3: 101509 – 99950.8
- 9. Resistances:
Only Psychological Resistance
- 10. Psychological Support:
120000.00000000
- 11. Psychological Resistance:
125000.00000000
- 3. Last 5 days’ closing prices:
2025-10-01: 118594.990000002025-10-02: 120529.350000002025-10-03: 122232.000000002025-10-04: 122391.000000002025-10-05: 123482.31000000
- 4. Volume:
BTC: 22043.0976USD: $2730817470.9396
- 5. Number of trades:
3690670
- 6. Indicators:
RSI: 81.9900MFI: 63.6600BB Upper: 123699.84000000BB Lower: 107482.47000000
- 7. Moving Averages:
SMA:7=119100.7900000014=115369.1700000021=115591.1500000030=114813.3900000050=113980.37000000100=113850.70000000200=104661.56000000EMA:
7=119739.5800000014=117353.1200000021=116276.9800000030=115552.6800000050=114703.60000000100=112383.66000000200=106489.82000000HMA:
7=124741.5500000014=123240.6500000021=119379.3600000030=116431.8500000050=115992.04000000100=113366.67000000200=118106.16000000 - 12. Funding Rate:
0.0096%
- 13. Open Interest:
96414.1390
- 14. Fear & Greed Index:
74 (Greed)
Disclaimer: This market analysis is generated by AI based on historical BTC data and sentiment indicators. Use it as a reference, not financial advice.
