
Market Analysis
This analysis explores the recent fluctuations in Bitcoin’s price, delving into the underlying factors that have influenced these movements. It reviews key news events and global financial trends that have shaped market sentiment, while also examining current technical indicators to assess potential market directions. The goal is to provide investors with a clearer perspective to make informed decisions.
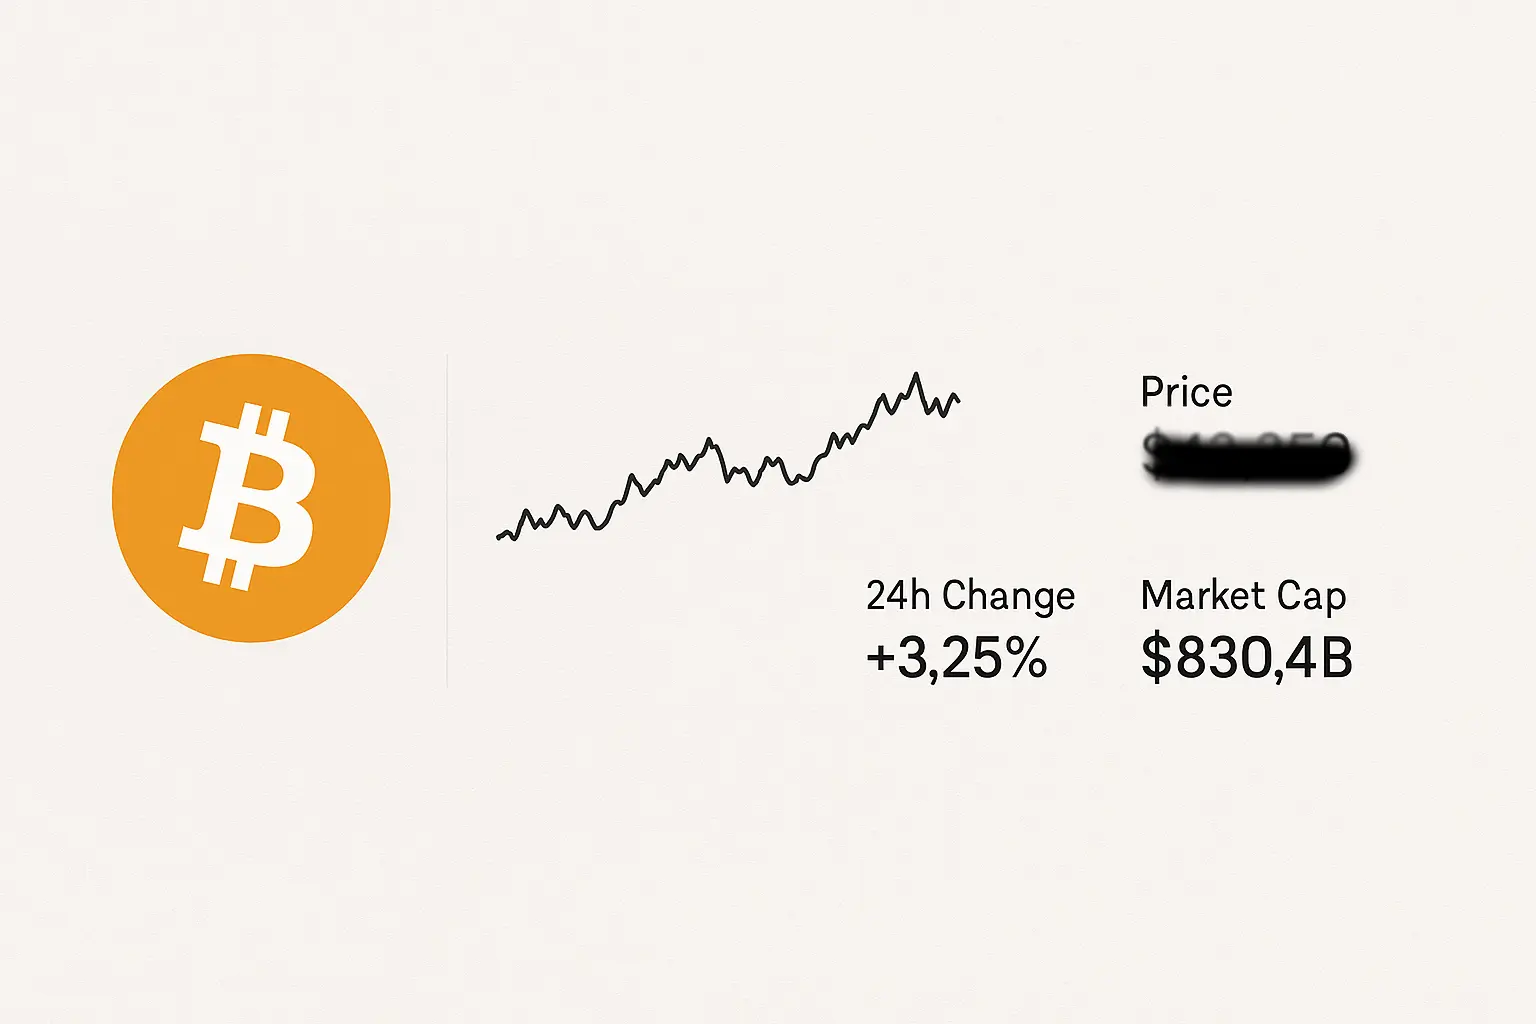
Over the past five days, Bitcoin has experienced notable volatility driven by shifts in global financial conditions and growing institutional interest. Between September 8 and 12, the price traded within a range of approximately $110,621 to $116,665, signaling a changing balance between buying and selling pressures. The Relative Strength Index (RSI) data confirmed initial market stability that gradually gave way to increased buying momentum. Meanwhile, the Money Flow Index (MFI) rose from 63 to 76, indicating heightened investor engagement and strong liquidity. The Fear & Greed Index also showed a slight improvement, reflecting a modest increase in market confidence.
From a news perspective, Meta Plant’s large-scale Bitcoin purchases have underscored rising institutional demand. However, recent hacks on various DeFi platforms and fund withdrawals from ETFs have introduced some elements of risk. Notably, investors shifting allocations from Ethereum to Bitcoin ETFs have helped reinforce the upward market trend. Additionally, uncertainty surrounding U.S. economic data and expectations of a potential Federal Reserve interest rate cut have positively influenced Bitcoin’s price. On the other hand, declining Google search interest in Bitcoin alongside rising gold prices points to emerging microeconomic challenges that may encourage investor caution.
Technically, the widening Bollinger Bands and Bitcoin’s testing of the upper band suggest increased volatility, with the price potentially entering an overbought zone in the short term. The price remains above the 7-, 14-, and 21-day Hull Moving Averages (HMA), signaling a strong short-term uptrend; however, the 100- and 200-day HMAs remain significantly above the current price, indicating potential resistance in the longer term. Support levels between $112,872 and $108,377 provide key safeguards against downward moves, while resistance near $119,177 to $120,000 may cap further advances. A slight rise in funding rates coupled with a decline in open interest points to cautious sentiment among investors over the short horizon.
Overall, Bitcoin’s current outlook reflects a balance between growing institutional investment and broader economic influences, supporting a positive price trajectory tempered by certain microeconomic and technical headwinds. Market sentiment remains moderate, suggesting the likelihood of some short-term price fluctuations, though fundamentals appear solid in the longer run. Investors are advised to monitor both news developments and technical signals closely to navigate uncertainties and make prudent decisions.
Data Summary
- 1. Time:
2025-09-13 – 00:00 UTC - 2. Prices:
Open: 115482.69000000High: 116665.63000000Low: 114740.99000000Close: 116029.42000000
- 8. Supports:
S1: 112872.94000000 – 112380.00000000S2: 108377.40000000 – 107172.52000000S3: 101508.68000000 – 99950.77000000S4: 96945.6 – 90056.2
- 9. Resistances:
R1: 119177.56000000 – 120998.71000000
- 10. Psychological Support:
110000.00000000
- 11. Psychological Resistance:
120000.00000000
- 3. Last 5 days’ closing prices:
2025-09-08: 112065.230000002025-09-09: 111546.390000002025-09-10: 113960.000000002025-09-11: 115482.690000002025-09-12: 116029.42000000
- 4. Volume:
BTC: 15324.1072USD: $1772122269.5019
- 5. Number of trades:
2481491
- 6. Indicators:
RSI: 73.8600MFI: 76.7500BB Upper: 116008.64000000BB Lower: 107235.06000000
- 7. Moving Averages:
SMA:7=112915.5800000014=111503.2700000021=111621.8500000030=113048.0800000050=114521.67000000100=111632.26000000200=101621.38000000EMA:
7=113584.4100000014=112699.4500000021=112675.3800000030=112875.4800000050=112863.88000000100=110502.49000000200=104225.48000000HMA:
7=116619.6600000014=114424.1800000021=113354.7500000030=111342.4600000050=109902.45000000100=113472.02000000200=118817.59000000 - 12. Funding Rate:
0.0069%
- 13. Open Interest:
92643.9210
- 14. Fear & Greed Index:
57 (Greed)
Disclaimer: This market analysis is generated by AI based on historical BTC data and sentiment indicators. Use it as a reference, not financial advice.
