
Market Analysis
In today’s analysis, we will explore the recent fluctuations in Bitcoin’s price by examining global financial developments and prevailing market sentiments. Investor caution and trends in institutional investment have played a significant role in shaping the current landscape. Against this backdrop, a comprehensive review of the market’s present condition will be provided to better anticipate potential future movements.
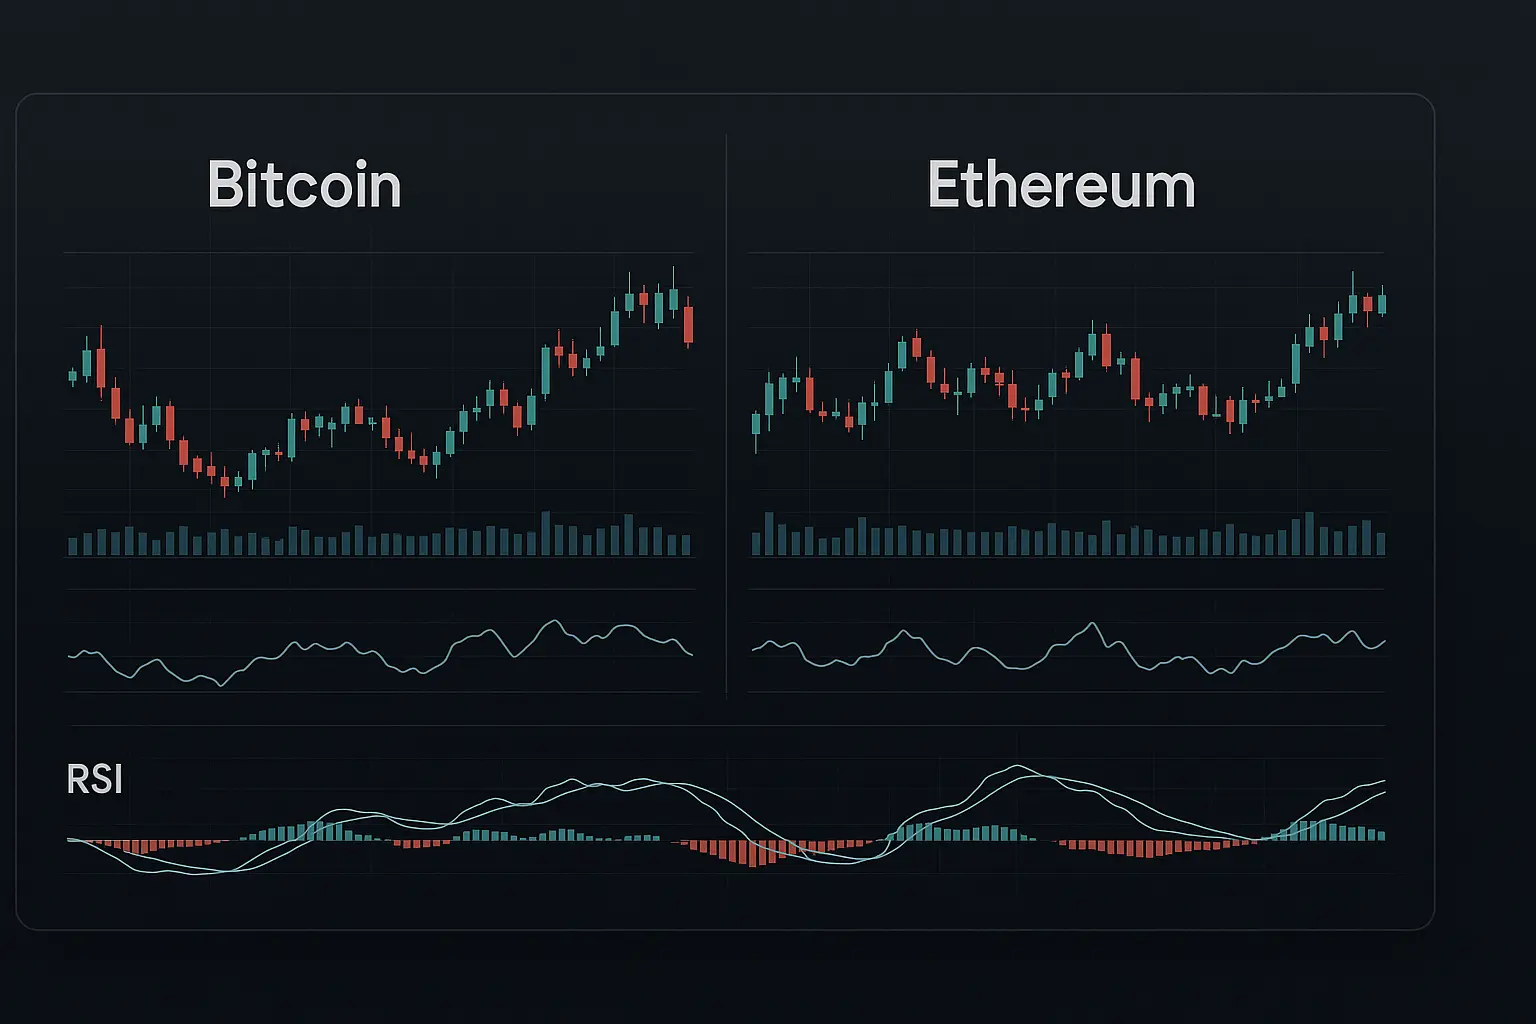
Over the past five days, Bitcoin’s price has experienced notable volatility driven by both global financial factors and internal dynamics within the crypto market. On August 18, the price reached a peak of 117,543 but then declined sharply to 112,732 on August 19, signaling a period of weakness. The Relative Strength Index (RSI) data corroborate this, indicating market pressure particularly on August 19 and 21, with RSI values near 33.84 and 35.38 respectively—levels that reflect subdued market sentiment. However, on August 22, the RSI rebounded to 54.16, suggesting a recovery in price momentum. Additionally, the Money Flow Index (MFI) remained above 50, indicating a balanced inflow of investment.
Looking at the Bollinger Bands, the price showed resilience by approaching the middle band on August 22 and attempted to push toward the upper band, a positive signal. In contrast, on August 19 and 21, the price hovered near the lower band, highlighting periods of vulnerability. Trading volume also saw significant variation, with a sharp increase on August 22, reflecting renewed buying interest. The number of trades rose correspondingly on the same day, signaling heightened market activity.
When analyzing trend indicators through moving averages, the data from August 22 showed some weakness compared to previous days, particularly with declines observed in the 7- and 14-day Hull Moving Averages. Nonetheless, the price managed to cross above these averages on August 22, which may indicate a potential positive shift. Support levels are identified starting at 116,462 and extending down to 111,684. A breach below 116,462 could expose further support around 112,546 and then 111,684. On the resistance side, a strong barrier exists between 119,177 and 120,998, which could pose a significant challenge for upward price movement.
From a news perspective, ongoing uncertainty in global financial markets and recent decisions by the U.S. Federal Reserve have influenced Bitcoin’s price action. Remarks by the Fed Chairman at the Jackson Hole Symposium introduced some stability, yet investors remain cautious. Large institutional players, often referred to as “whales,” have increased their Bitcoin purchases, capitalizing on price dips. Conversely, some investors have reduced their holdings, particularly through fund withdrawals from ETFs, reflecting risk-averse behavior. This has led to a mixed sentiment across the market.
The current reading of the Fear and Greed Index hovers near 50, indicating neither excessive fear nor extreme greed. This suggests a balanced market atmosphere where investors are adopting a cautious stance. In such an environment, price movements are likely to remain limited and restrained unless new significant financial news or global developments emerge.
Overall, Bitcoin’s recent price fluctuations are the result of a complex interplay between global financial conditions, institutional investment trends, and market sentiment. The price is currently stabilizing near 116,000, while resistance above 119,000 appears difficult to surpass. Should any key support levels fail, a decline toward the psychologically important 112,000 mark could occur. Given the prevailing equilibrium and uncertainty, investors are advised to exercise caution and closely monitor developments in global finance and news for signs of major shifts.
Data Summary
- 1. Time:
2025-08-23 – 00:00 UTC - 2. Prices:
Open: 112500.00000000High: 117429.05000000Low: 111684.79000000Close: 116935.99000000
- 8. Supports:
S1: 116462.25000000 – 115736.92000000S2: 112546.35000000 – 111684.79000000S3: 105681.14000000 – 104872.50000000S4: 96945.6 – 90056.2
- 9. Resistances:
R1: 119177.56000000 – 120998.71000000
- 10. Psychological Support:
110000.00000000
- 11. Psychological Resistance:
120000.00000000
- 3. Last 5 days’ closing prices:
2025-08-18: 116227.050000002025-08-19: 112872.940000002025-08-20: 114271.240000002025-08-21: 112500.000000002025-08-22: 116935.99000000
- 4. Volume:
BTC: 23128.0904USD: $2656625122.2778
- 5. Number of trades:
3438518
- 6. Indicators:
RSI: 54.1600MFI: 56.4700BB Upper: 120405.35000000BB Lower: 111535.40000000
- 7. Moving Averages:
SMA:7=115946.7600000014=116121.9500000021=115970.3800000030=116662.1500000050=115133.32000000100=110488.85000000200=100171.75000000EMA:
7=115496.7000000014=115880.0800000021=115944.0400000030=115663.4700000050=114262.90000000100=109876.96000000200=102488.53000000HMA:
7=113696.2300000014=114470.9100000021=115971.2600000030=115934.8000000050=116300.29000000100=119615.71000000200=120131.67000000 - 12. Funding Rate:
0.0059%
- 13. Open Interest:
89657.8480
- 14. Fear & Greed Index:
50 (Neutral)
Disclaimer: This market analysis is generated by AI based on historical BTC data and sentiment indicators. Use it as a reference, not financial advice.
