
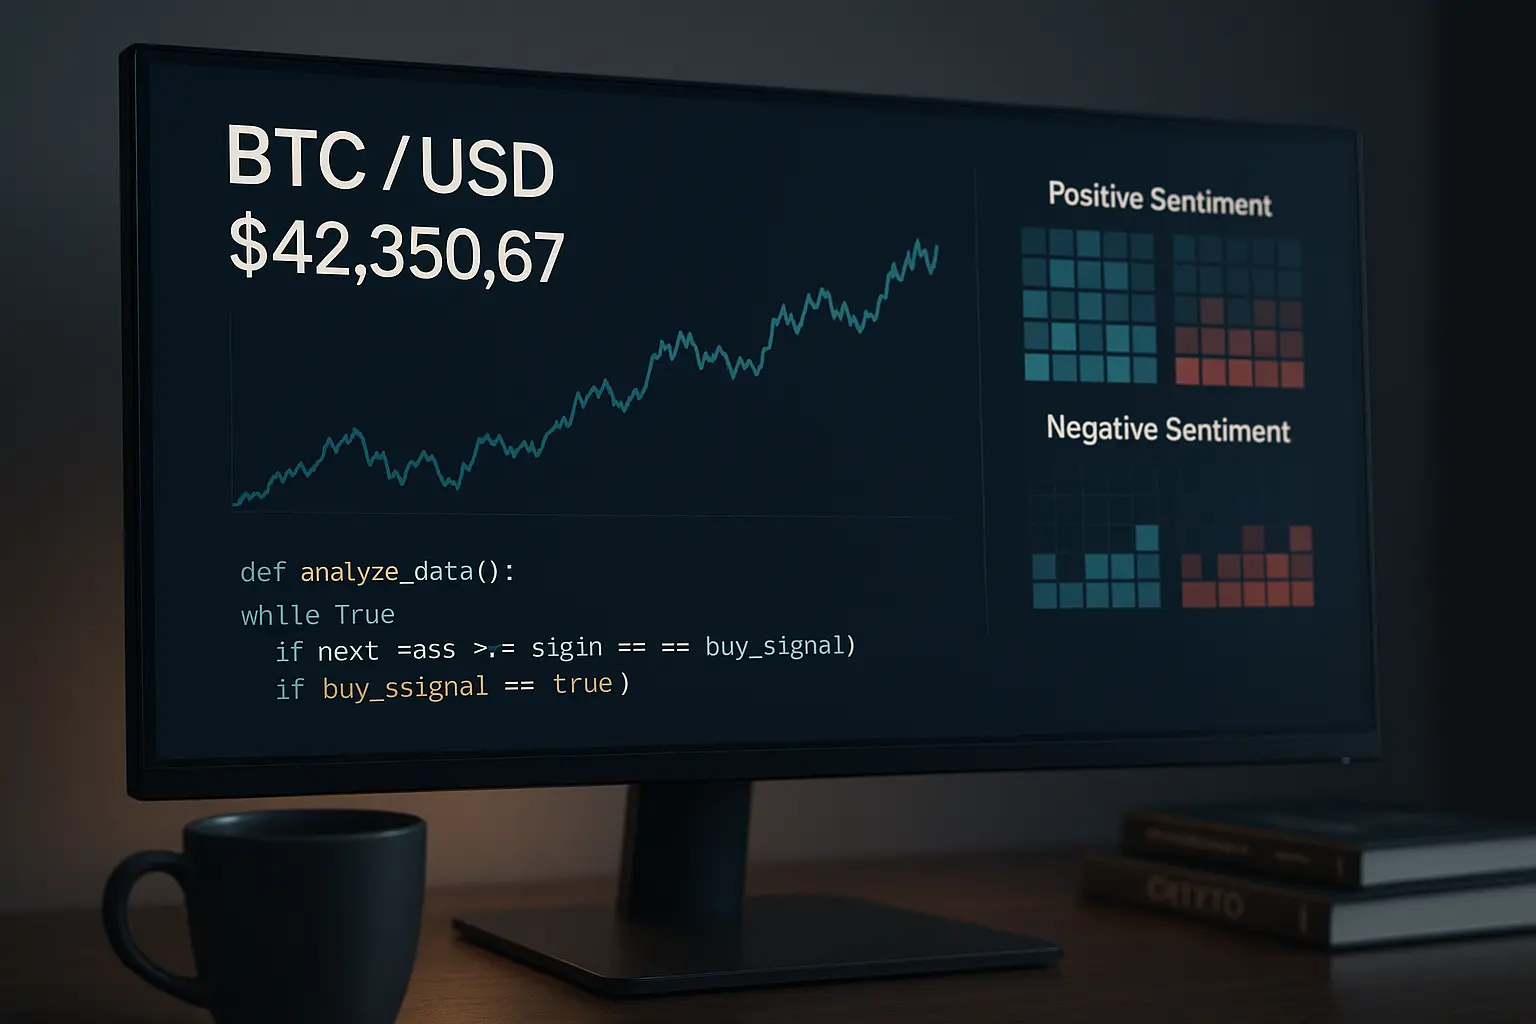
Market Analysis
Bitcoin’s price in the cryptocurrency market has exhibited notable volatility in recent days, influenced significantly by global economic uncertainties and political developments. This report delves into the key factors affecting Bitcoin’s value and aims to provide a clear understanding of the current market trends.
Over the past five days, Bitcoin’s price has experienced moderate fluctuations driven not only by technical indicators but also by global news and investor sentiment. On August 4th, the price opened near 114,208 USDT and climbed to 115,720 USDT during the day, eventually closing around 116,674 USDT on August 8th. The Relative Strength Index (RSI) started at 44.14 on August 4th, dropped to 38.93 on August 5th, and then surged to a strong 60.83 by August 7th, signaling a price recovery and renewed positive momentum. Meanwhile, the Money Flow Index (MFI) showed improvement from 15.73 on August 14th to 37.85, indicating increased cash inflows into the market. Price movements near the middle line of the Bollinger Bands, combined with a move toward the upper band, suggest that despite volatility, buying pressure remains present.
On the macro front, Bitcoin’s price has been supported by a weakening US dollar and market expectations of a potential interest rate cut by the Federal Reserve. The Swiss government’s preparations for trade talks with US officials, combined with ongoing political and economic uncertainties in the United States, have kept investors actively engaged. Additionally, increased investment in Bitcoin ETFs and the inclusion of cryptocurrencies in 401(k) retirement plans have bolstered long-term confidence. However, rising global trade tensions and proposals for new tax regulations present medium-term risks.
Looking at moving averages, the 7-day Hull Moving Average (HMA) is near 117,433, with the price closing just below this level on August 8th. The upward trend in recent HMAs suggests a positive short-term outlook. The 14-day and 21-day HMAs are also trending upwards, indicating strength in the medium term. Support levels are established between 114,129 and 101,508 USDT, providing solid defense zones in case of a price dip, while resistance is identified between 119,177 and 120,998 USDT. Psychological support and resistance at 110,000 and 120,000 USDT respectively serve as key pivot points for market direction.
The Fear and Greed Index currently stands at 74, reflecting a “greedy” sentiment but not at an extreme level, which means short-term selling pressure could emerge despite an overall positive mood. Funding rates remain positive; however, a decline in open interest points to a cautious stance among traders. Taking all news and technical signals into account, Bitcoin’s price appears to be in a steady yet cautious recovery phase, with investors closely monitoring global political and economic developments.
Current price levels and indicators like RSI and MFI confirm that buying strength persists, though resistance near 120,000 USDT could pose challenges. A slight widening of the Bollinger Bands indicates increased volatility potential, suggesting short-term price uncertainty. Positive factors such as the weakening US dollar and anticipated Federal Reserve policy easing create a supportive environment for Bitcoin, but concerns over trade disputes and new tax proposals may restrict price momentum.
In summary, Bitcoin is trending cautiously upward, with investors making decisions in response to both global and domestic news. Price movement is expected to continue fluctuating between established support and resistance levels, with any significant geopolitical or economic developments likely to trigger notable shifts in the market. Investors are advised to carefully consider both technical and fundamental factors as the market remains susceptible to both upward rallies and downward corrections.
Data Summary
- 1. Time:
2025-08-09 – 00:00 UTC - 2. Prices:
Open: 117472.02000000High: 117630.00000000Low: 115878.71000000Close: 116674.74000000
- 8. Supports:
S1: 114129.75000000 – 108262.94000000S2: 101508.68000000 – 99950.77000000S3: 96945.6 – 90056.2
- 9. Resistances:
R1: 119177.56000000 – 120998.71000000
- 10. Psychological Support:
110000.00000000
- 11. Psychological Resistance:
120000.00000000
- 3. Last 5 days’ closing prices:
2025-08-04: 115055.030000002025-08-05: 114129.750000002025-08-06: 114992.270000002025-08-07: 117472.010000002025-08-08: 116674.74000000
- 4. Volume:
BTC: 10045.3128USD: $1172199778.7243
- 5. Number of trades:
2095304
- 6. Indicators:
RSI: 55.1200MFI: 37.8500BB Upper: 120751.22000000BB Lower: 112818.40000000
- 7. Moving Averages:
SMA:7=115011.2800000014=116094.9900000021=116784.8100000030=117195.2500000050=113114.27000000100=108798.44000000200=99600.58000000EMA:
7=115835.3700000014=115945.6500000021=115842.2700000030=115285.4000000050=113413.35000000100=108610.32000000200=101184.29000000HMA:
7=117433.4100000014=115063.7000000021=114056.2200000030=114612.6800000050=117845.30000000100=118784.21000000200=118928.81000000 - 12. Funding Rate:
0.008%
- 13. Open Interest:
82983.9100
- 14. Fear & Greed Index:
74 (Greed)
Disclaimer: This market analysis is generated by AI based on historical BTC data and sentiment indicators. Use it as a reference, not financial advice.
