
Market Analysis
**Introduction**
Bitcoin has once again demonstrated its strength in the market by reaching a new all-time high, reflecting a complex interplay of investor confidence and global financial conditions. Against this historic backdrop, today we will delve into the underlying news and market sentiment to assess Bitcoin’s potential trajectory and associated risks, providing readers with a clearer understanding of the current landscape.
**Analysis**
Over the past five days, Bitcoin’s price has experienced significant volatility, including the setting of a new record high. On July 27, 2025, the price peaked at 119,766.65 USDT, signaling strong market momentum. However, this was followed by a slight pullback and subsequent stabilization. Trading volume data shows increased activity, particularly on July 29 and 30, when volumes surpassed 15,000 and the number of trades approached 200,000, indicating heightened market interest.
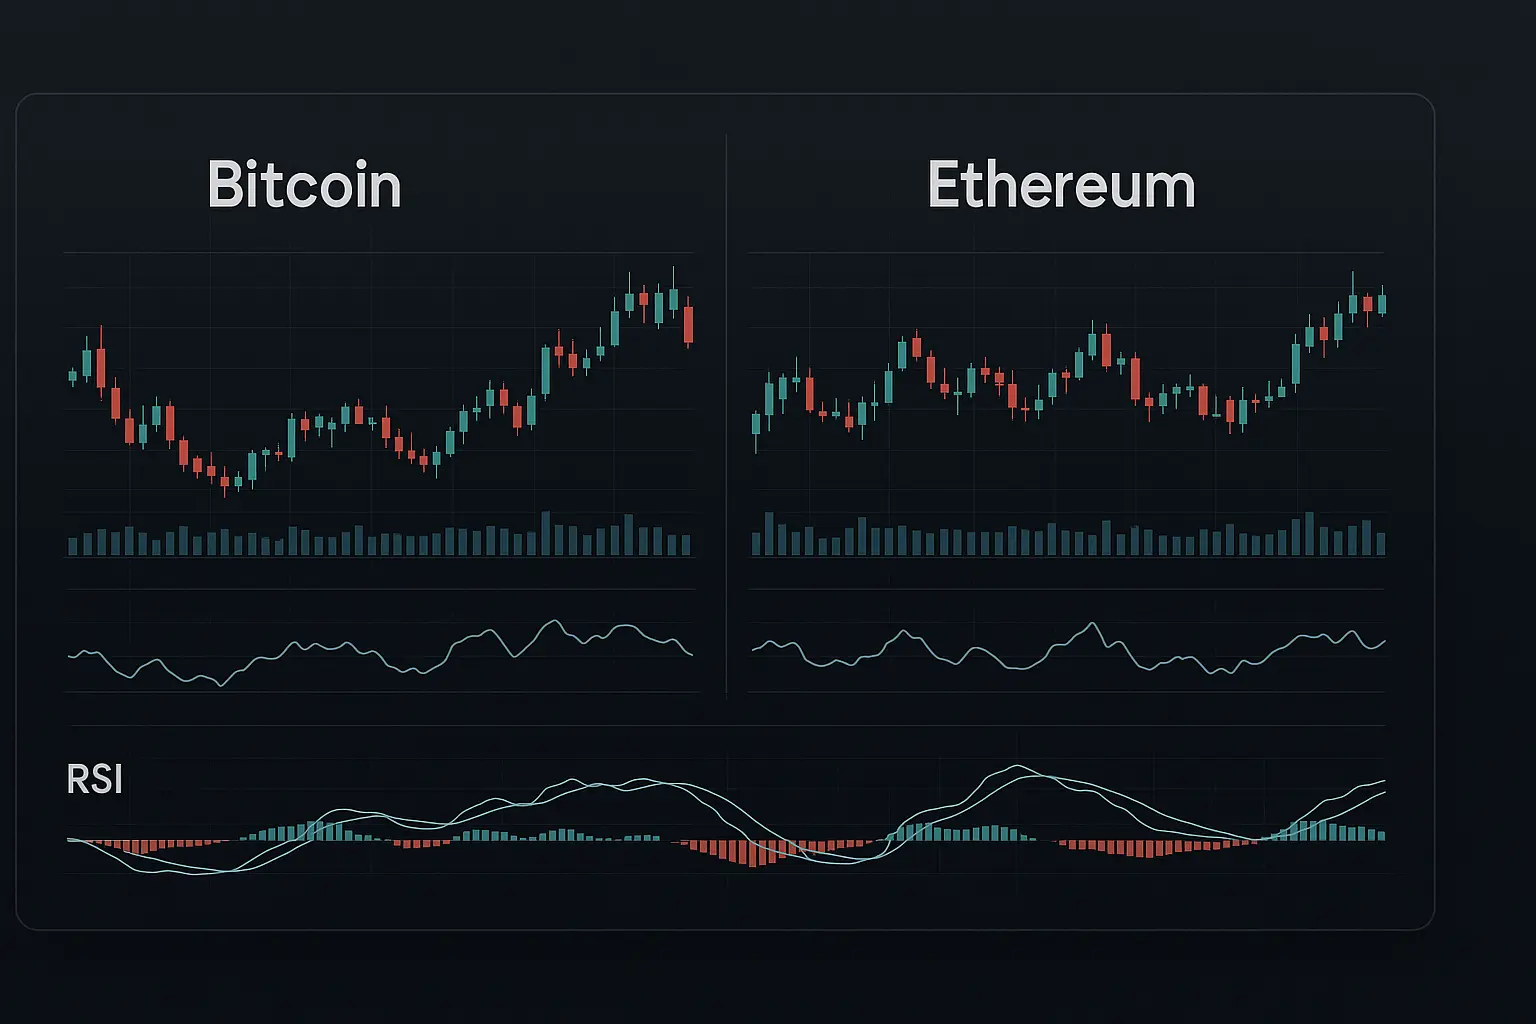
The Relative Strength Index (RSI) has remained above 50, although it has shown a modest downward trend over the past week, suggesting moderate market pressure. Similarly, the Money Flow Index (MFI) declined to 31.56, hinting at a slight reduction in liquidity, but since it did not enter oversold territory, the market does not appear to be signaling outright weakness.
Looking at Bollinger Bands, Bitcoin’s price has largely hovered near the middle band, indicating no immediate signs of breakout or contraction. However, the proximity to the upper band suggests potential for future upward movement. Analysis of moving averages, particularly the Hull Moving Average (HMA), reveals that recent prices have stayed above the moving average line. A slight dip in the HMA compared to the previous day, however, tempers this optimism and reflects a more cautious market stance.
Key support levels are identified in the ranges of 117,758.09 to 115,222.22 USDT, with a secondary support zone between 105,681.14 and 104,872.50 USDT. Resistance lies within the 119,177.56 to 120,998.71 range, with the psychological barrier of 120,000 USDT being especially critical. A decisive break above this level could pave the way for further upside.
On the macroeconomic front, signs of potential easing in global monetary policies—particularly indications that the U.S. Federal Reserve may reduce interest rates—are viewed positively for Bitcoin and the broader crypto market. Conversely, political and economic uncertainties, including tighter U.S. trade policies and financial challenges facing large institutions, are fostering a cautious market mood. The Fear and Greed Index hovers near 70, indicative of a generally optimistic ("greedy") environment but not at an extreme, suggesting the possibility of short-term sell-offs, especially by large investors.
In summary, the market environment currently reflects a balance between stability and caution. Prices remain near their all-time highs, supported by solid trading activity, yet underlying uncertainties persist. Bitcoin’s recent price movement suggests a measured but careful upward trend, with both support and resistance levels playing a crucial role in determining its next direction. Investors are advised to approach the market with a thorough understanding of these dynamics, as volatility remains a possibility and prices could shift in either direction despite recent strength.
Data Summary
- 1. Time:
2025-07-31 – 00:00 UTC - 2. Prices:
Open: 117950.75000000High: 118792.00000000Low: 115796.23000000Close: 117840.30000000
- 3. Last 5 days’ closing prices:
2025-07-26: 117919.990000002025-07-27: 119415.550000002025-07-28: 118062.320000002025-07-29: 117950.760000002025-07-30: 117840.30000000
- 4. Volume:
BTC: 15586.7363USD: $1832696878.2230
- 5. Number of trades:
1997369
- 6. Indicators:
RSI: 50.1900MFI: 31.5600BB Upper: 120024.95000000BB Lower: 116329.00000000MACD: 1861.79000000Signal: 2330.91000000Histogram: -469.12000000
- 7. Moving Averages:
SMA:7=118163.4600000014=118245.8900000021=118176.9800000030=115321.2700000050=111477.11000000100=106932.73000000200=98921.64000000EMA:
7=118136.3800000014=117718.8700000021=116791.8000000030=115463.7300000050=112725.23000000100=107359.58000000200=99889.97000000HMA:
7=117863.4600000014=118182.4000000021=118366.8300000030=119516.0400000050=121323.02000000100=117421.09000000200=117074.38000000 - 8. Supports:
S1: 117758.09000000 – 115222.22000000S2: 105681.14000000 – 104872.50000000S3: 101509 – 99950.8
- 9. Resistances:
R1: 119177.56000000 – 120998.71000000
- 10. Psychological Support:
110000.00000000
- 11. Psychological Resistance:
120000.00000000
- 12. Funding Rate:
0.01%
- 13. Open Interest:
90965.9430
- 14. Fear & Greed Index:
74 (Greed)
Disclaimer: This market analysis is generated by AI based on historical BTC data and sentiment indicators. Use it as a reference, not financial advice.
