
Market Analysis
**Introduction**
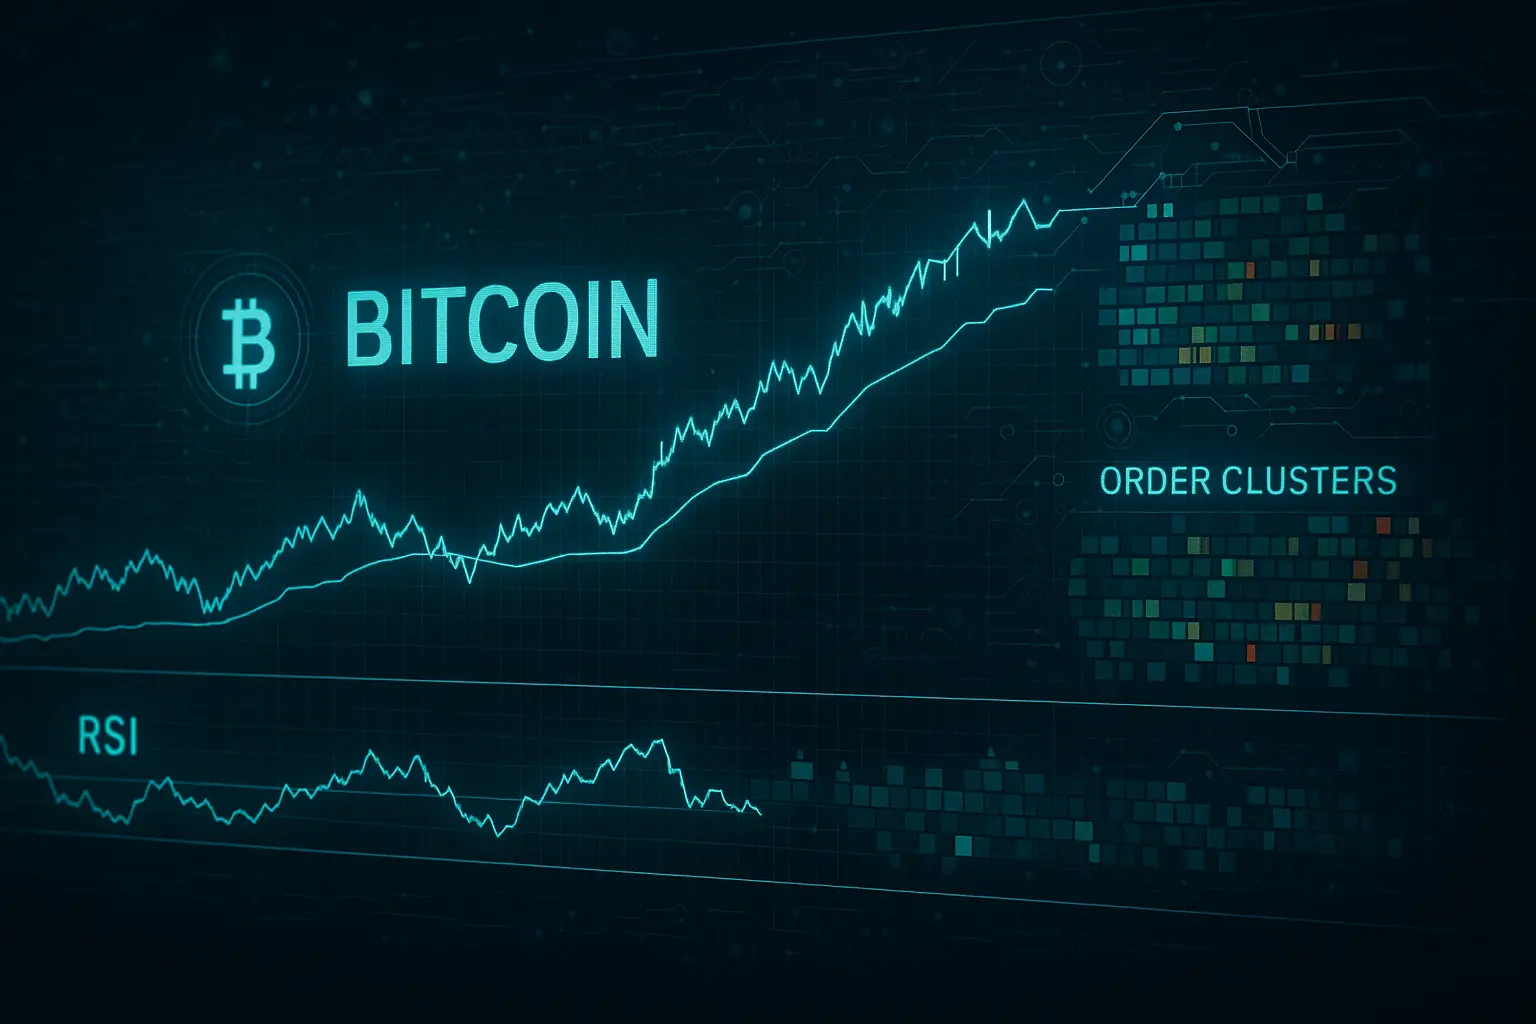
Bitcoin has once again demonstrated its strength by reaching a new all-time high, reigniting investor interest while reflecting broader shifts in global financial and technological landscapes. Today’s analysis will delve into the complex factors and market sentiments driving this latest peak.
**Market Analysis**
Over the past five days, Bitcoin’s price and trading volume have exhibited notable volatility and growth, injecting fresh momentum into the market. Reviewing data from July 20 to July 24 reveals that Bitcoin fluctuated within a price range of approximately 116,128 to 120,247 USDT, surpassing its previous all-time high on July 22. Trading volumes surged significantly during this period, signaling heightened investor engagement. Specifically, on July 22, volume approached 20,959 with over 2.77 million contracts traded, underscoring a strong buying trend.
The Relative Strength Index (RSI) with a 7-day period peaked at 71.96, entering the overbought territory and suggesting a potential short-term price correction. However, on July 23 and 24, the RSI stabilized between 57.77 and 61.24, indicating that the market maintained considerable strength. Similarly, the 14-day Money Flow Index (MFI) rose near 70.45, signaling increased buying pressure, before retreating to 58.33, which points toward a more balanced market condition.
From a Bollinger Bands perspective, Bitcoin’s price touched the upper band on July 22—a bullish indication—but subsequently retreated toward the middle band, hinting at a temporary pullback. Key support levels are identified within the S1 range of 115,222 to 117,758 USDT, close to the current price. Should this range fail to hold, stronger support lies in the S3 range from 104,872 to 105,681 USDT. Resistance is found in the R1 range between 119,841 and 123,218 USDT, near the current all-time high, where a breakout could pave the way for further gains. Psychological levels also play an important role: 110,000 USDT serves as a critical support, while 120,000 USDT acts as a psychological resistance influencing near-term price movements.
Sentiment indicators show a Fear & Greed Index around 71, reflecting optimistic investor sentiment without reaching extreme greed, which may prompt short-term profit-taking. Open interest has decreased by about 3.22%, and the funding rate is slightly positive, together suggesting cautious optimism and a balanced market outlook. News flow presents a mixed picture for Bitcoin: growing interest in ETFs and significant purchases by major corporations provide strong support, while geopolitical and economic uncertainties—such as US trade tensions and potential Federal Reserve decisions—pose challenges. Additionally, tightening regulations on stablecoins and supply constraints could impact Bitcoin’s price trajectory.
Overall, Bitcoin’s current stance reflects a cautiously optimistic uptrend, where investors should monitor key support and resistance levels before making decisive moves. Despite the enthusiasm generated by the new all-time high, RSI and MFI signals along with funding trends point to the possibility of short-term consolidation or correction. In this dynamic environment, global political and economic developments, along with major investment flows, will continue to shape Bitcoin’s direction. Careful observation of market sentiment and technical indicators is essential for informed decision-making.
Data Summary
- 1. Time:
2025-07-25 – 00:00 UTC - 2. Prices:
Open: 118756.00000000High: 119450.00000000Low: 117103.10000000Close: 118340.99000000
- 3. Last 5 days’ closing prices:
2025-07-20: 117265.120000002025-07-21: 117380.360000002025-07-22: 119954.420000002025-07-23: 118755.990000002025-07-24: 118340.99000000
- 4. Volume:
BTC: 15806.8904USD: $1873181653.2018
- 5. Number of trades:
2081435
- 6. Indicators:
RSI: 57.7700MFI: 58.3300BB Upper: 124153.95000000BB Lower: 106962.19000000MACD: 2726.96000000Signal: 2890.25000000Histogram: -163.29000000
- 7. Moving Averages:
SMA:7=118208.8200000014=118350.2300000021=115558.0700000030=113165.6800000050=110053.46000000100=104956.96000000200=98258.27000000EMA:
7=118318.4900000014=117169.1100000021=115760.3200000030=114151.2700000050=111258.25000000100=105985.90000000200=98761.83000000HMA:
7=119201.2800000014=118427.8700000021=119534.5900000030=121030.4400000050=119749.14000000100=115097.86000000200=114957.93000000 - 8. Supports:
S1: 117758.09000000 – 115222.22000000S2: 105681.14000000 – 104872.50000000S3: 101509 – 99950.8
- 9. Resistances:
R1: 119841.18000000 – 123218.00000000
- 10. Psychological Support:
110000.00000000
- 11. Psychological Resistance:
120000.00000000
- 12. Funding Rate:
0.01%
- 13. Open Interest:
87174.5980
- 14. Fear & Greed Index:
71 (Greed)
Disclaimer: This market analysis is generated by AI based on historical BTC data and sentiment indicators. Use it as a reference, not financial advice.
