
Market Analysis
Certainly! Here's a polished and professional English version of the provided Urdu introduction and analysis, naturally rewritten for clarity and fluency:
—
**Introduction**
Bitcoin has once again demonstrated its strong foothold in the cryptocurrency market by reaching a new all-time high, reflecting growing investor confidence and increasing liquidity. This achievement is largely driven by shifting trends in the global financial landscape and a surge in institutional investment interest.
—
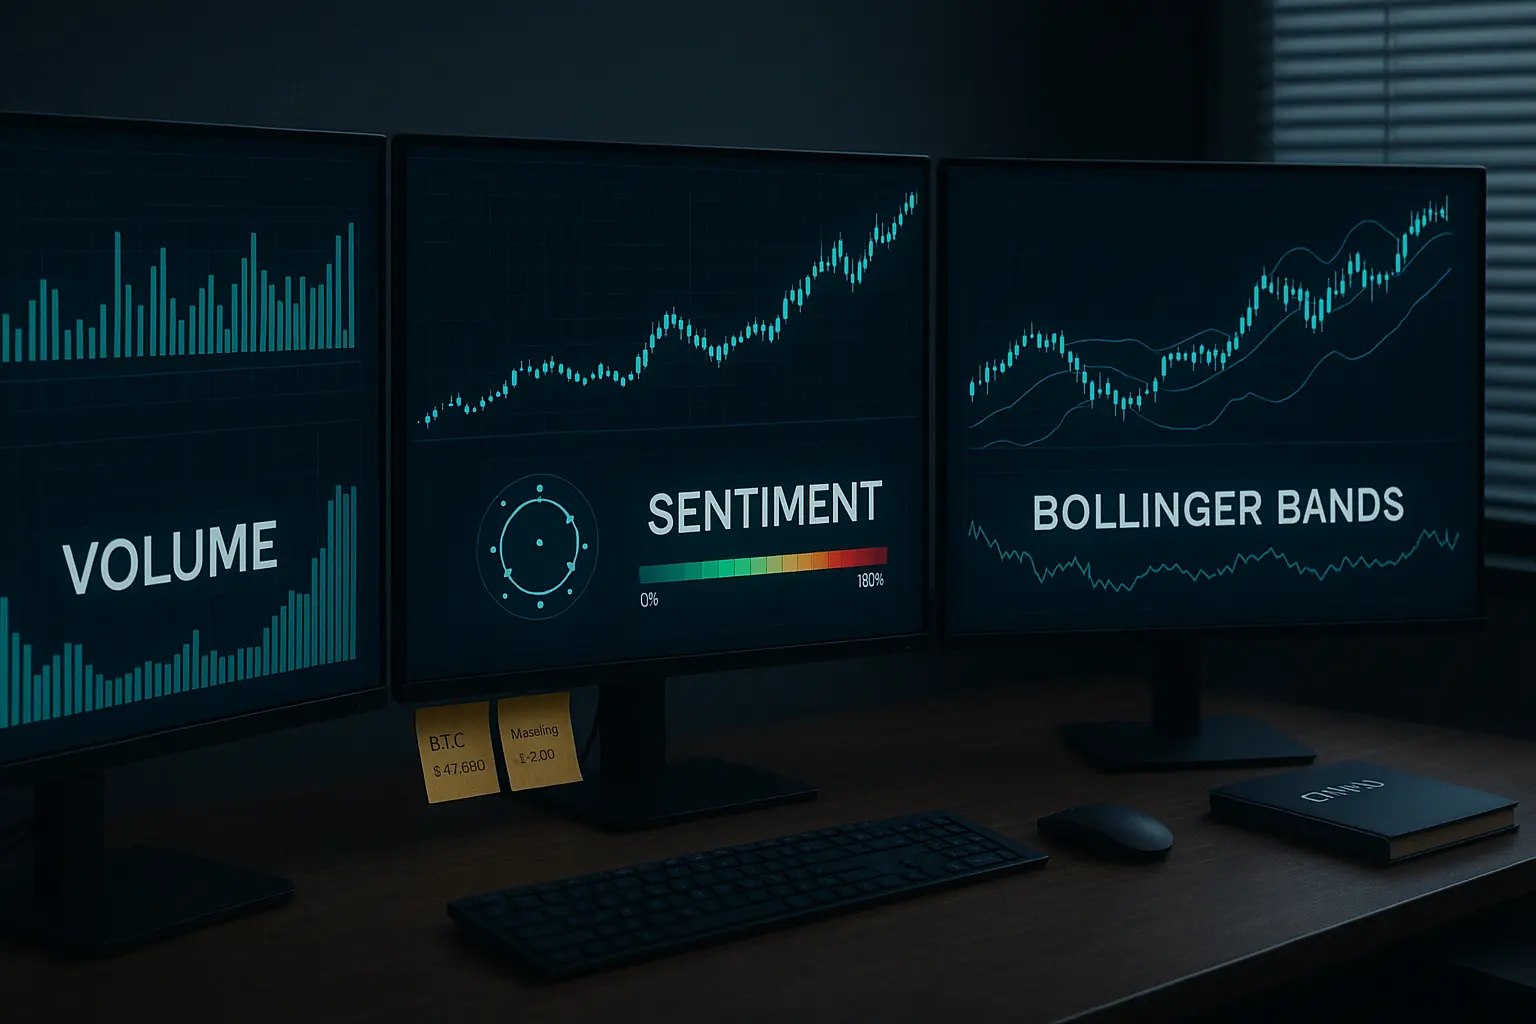
**Market Analysis**
Over the past five days, Bitcoin's price has experienced significant volatility, marked by a new peak as well as corrective phases. On July 11th, Bitcoin touched a high near 118,869, signaling fresh capital inflows and robust liquidity in the market, especially supported by an increase in the supply of stablecoins. During this period, investments through ETFs and sizeable institutional purchases of Bitcoin reserves helped bolster the price.
However, on July 15th, a slight pullback was observed due to short-covering and profit-taking activities. The 7-day Relative Strength Index (RSI) dropped from an overbought 86.7 down to 69.48, indicating a moderation from overheated conditions towards a more balanced state. Similarly, the 14-day Money Flow Index (MFI) decreased from 82.7 to 73.81, further suggesting a partial stabilization in the market.
Bollinger Bands analysis shows that on July 14th, Bitcoin’s price touched the upper band, reflecting increased volume and bullish momentum. Yet, on July 15th, the price retreated below the upper band, indicating a minor correction. Trading volume peaked on July 15th at 32,018, highlighting active investor participation amid price fluctuations. The number of trades also varied, underscoring dynamic market engagement.
Examining moving averages, particularly the Hull Moving Average (HMA), the readings on July 14th and 15th confirm an ongoing upward trend. Closing prices remained above the HMA, which itself showed rising values—a signal of sustained bullish momentum.
In terms of technical levels, the range between 117,420 and 108,262 acts as the primary support zone. Should this break, the next support lies between 105,681 and 104,872. On the resistance side, the band from 119,841 to 123,218 is critical, with the psychological level at 120,000 presenting a notable challenge. The Fear and Greed Index stands close to 73, suggesting moderate greed in the market—enough to fuel optimism but not excessive enough to trigger immediate selling pressure.
Furthermore, rising funding rates and open interest indicate that investors, especially institutions, remain engaged and bullish. News developments such as a record increase in stablecoin supply and significant investment from Nasdaq-listed company Upexi have injected additional energy and confidence into the market.
Following Bitcoin's new high, increased activity has also been seen in meme coins and smaller tokens, contributing to heightened overall crypto market momentum. However, there are reports of some whales increasing short positions alongside retail investors exiting, hinting at potential short-term price corrections. Moreover, uncertainty surrounding potential Federal Reserve interest rate adjustments and the broader global economic outlook has fostered a cautious market sentiment.
In summary, Bitcoin’s fresh all-time high has generated positive momentum, but it is prudent to remain vigilant considering both technical indicators and market sentiment. Some corrective pressure may arise as RSI and MFI retreat from overbought levels. Nonetheless, strong support zones and growing institutional participation could help stabilize the market. Investors are advised to balance short- and medium-term perspectives to navigate the prevailing uncertainties with a well-informed strategy.
Data Summary
- 1. Time:
2025-07-16 – 00:00 UTC - 2. Prices:
Open: 119841.17000000High: 119940.83000000Low: 115736.92000000Close: 117758.09000000
- 3. Last 5 days’ closing prices:
2025-07-11: 117527.660000002025-07-12: 117420.000000002025-07-13: 119086.640000002025-07-14: 119841.180000002025-07-15: 117758.09000000
- 4. Volume:
BTC: 32018.4608USD: $3755258445.5533
- 5. Number of trades:
3805374
- 6. Indicators:
RSI: 69.4800MFI: 73.8100BB Upper: 120155.25000000BB Lower: 101721.00000000MACD: 3303.76000000Signal: 2316.66000000Histogram: 987.10000000
- 7. Moving Averages:
SMA:7=116982.5100000014=112848.8600000021=110938.1300000030=108946.3500000050=107797.30000000100=101688.30000000200=97240.63000000EMA:
7=116640.1900000014=113939.3400000021=112197.5100000030=110676.1700000050=108175.99000000100=103544.18000000200=96915.73000000HMA:
7=119848.2200000014=120569.8700000021=118846.8100000030=116449.7800000050=113021.68000000100=110851.05000000200=111118.67000000 - 8. Supports:
S1: 117420.00000000 – 108262.94000000S2: 105681.14000000 – 104872.50000000S3: 101509 – 99950.8
- 9. Resistances:
R1: 119841.18000000 – 123218.00000000
- 10. Psychological Support:
110000.00000000
- 11. Psychological Resistance:
120000.00000000
- 12. Funding Rate:
0.01%
- 13. Open Interest:
93070.3340
- 14. Fear & Greed Index:
73 (Greed)
Disclaimer: This market analysis is generated by AI based on historical BTC data and sentiment indicators. Use it as a reference, not financial advice.
