
Market Analysis
Certainly! Below is a polished, professional English reframing of the provided Urdu crypto market introduction and analysis, rewritten smoothly and naturally without literal translation:
—
**Introduction**
Recent price movements in Bitcoin have introduced a notable sense of uncertainty and caution across the market. In today’s analysis, we will explore the underlying factors and technical indicators driving these shifts, aiming to better understand the potential direction of Bitcoin’s price amid the current landscape.
—
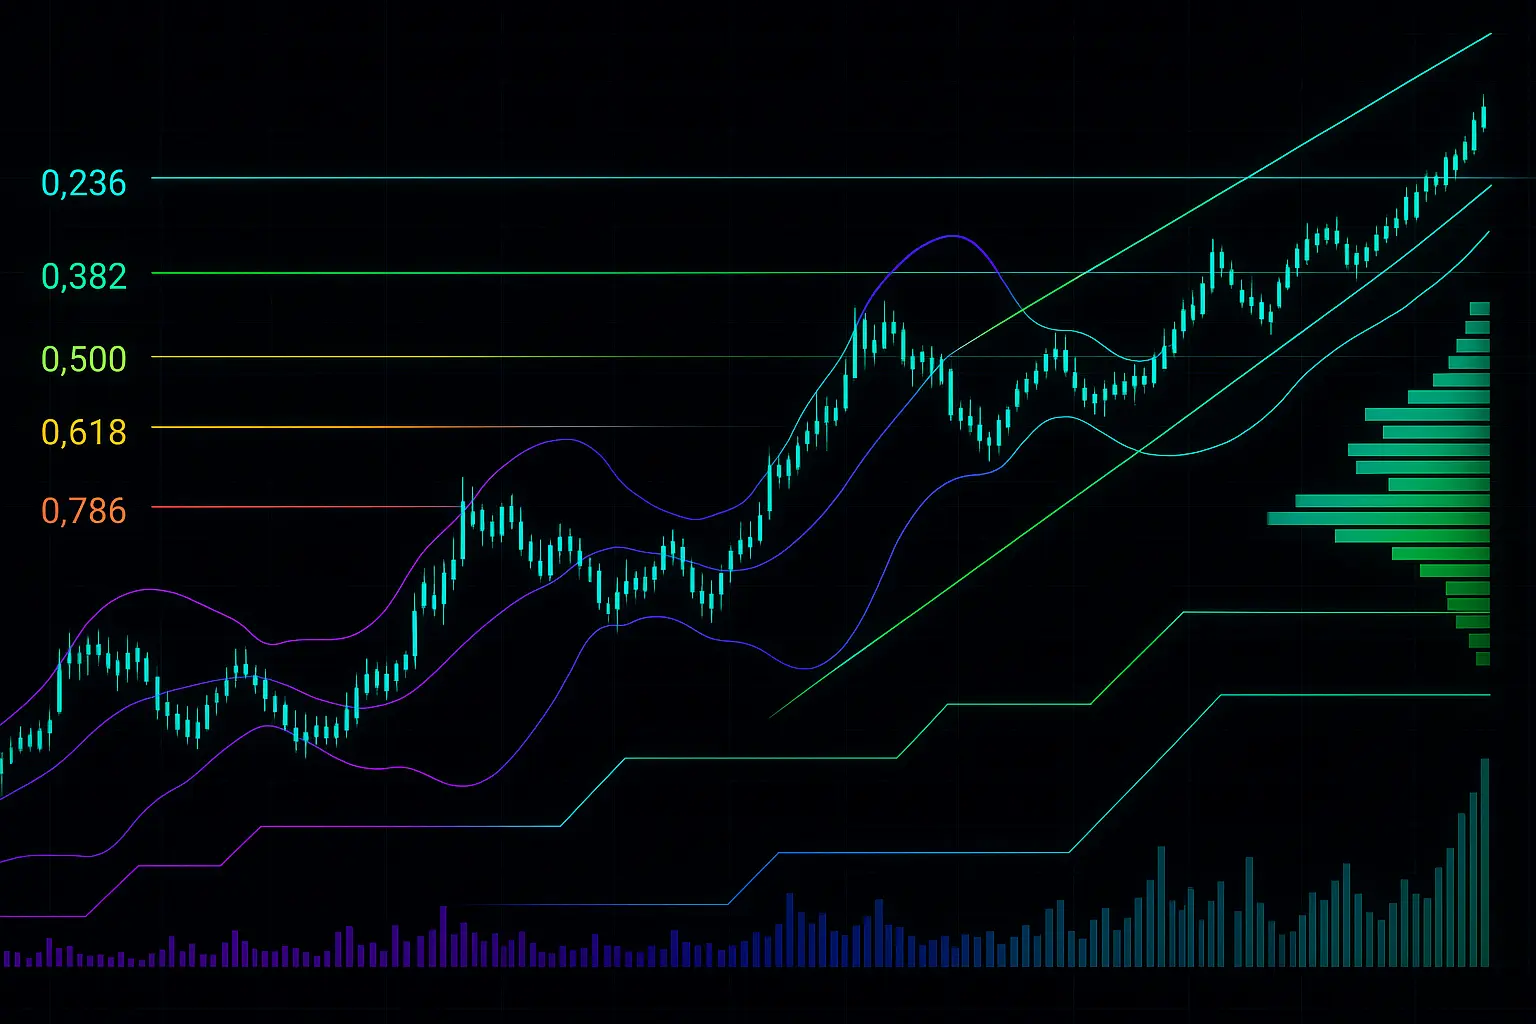
**Market Analysis**
Bitcoin recently attempted to break above the upper boundary of its prolonged sideways trading range between 85,000 and 110,000. However, it encountered a strong liquidity cluster near 113,000, which prevented further upward momentum. Examining data from the past five days reveals a clear downward trend, particularly between June 20 and June 22, when the price declined from 104,658 to 100,963. During this period, the Relative Strength Index (RSI) dropped sharply from 34 to 25, and the Money Flow Index (MFI) fell from 43 to 31, both signaling weakened buying interest and diminished capital inflows. The MACD indicator has also deepened into negative territory, reinforcing bearish sentiment.
Volume showed fluctuations, with a significant spike on June 22 indicating increased selling pressure. Following this, the price saw a modest recovery between June 23 and 24, rising from 105,333 to 106,083. However, this rebound appears limited and fragile, as the MFI remains near 32 and the MACD continues to signal weakness, suggesting that buying momentum is still insufficient to sustain a robust uptrend.
Looking at Bollinger Bands, Bitcoin closed near the middle band around 105,352 on June 24, with the upper band at approximately 110,017 and the lower band near 100,687. This indicates that the price remains close to its intermediate trend without significant expansion in volatility, implying neither a strong rally nor a sharp decline is imminent.
Moving averages add further nuance. The Hull Moving Average (HMA) data for June 23 and 24 shows the 7-day HMA near 105,068, closely aligned with the current price, while the 14-day HMA lags at about 102,907. The closing price on June 24 at 106,083 sits above the 7-day HMA but still below the 14 and 21-day moving averages, suggesting a mildly improving short-term trend, though the longer-term outlook remains cautiously bearish.
Regarding support and resistance, the price’s close at 106,083 places it near the first resistance zone between 106,133 and 108,891. Breaking through this range could open the door to a higher resistance band between 110,274 and 110,797, which carries considerable significance over the longer term. Conversely, on the downside, strong support lies between 103,985 and 103,105, with an additional support range from 101,508 to 99,950. Notably, the psychological support level at 100,000 remains a crucial threshold; falling below this could intensify downward pressure.
The Fear and Greed Index currently stands at 65, reflecting a sentiment that is moderately optimistic but not overheated, reducing the immediate risk of excessive short-term selling. Additionally, the financing rate remains very low at 0.000004, and open interest has declined by approximately 7.7%, indicating a slight weakening and cautious sentiment among market participants.
From a macro perspective, ongoing economic uncertainties contribute to mixed signals for Bitcoin. Potential interest rate cuts by the Federal Reserve may increase risk appetite and benefit the cryptocurrency. However, geopolitical tensions—particularly the Israel-Iran conflict—alongside tightening liquidity conditions are exerting downward pressure on prices and increasing volatility. Technically, the CME futures gap above 92,000 presents a likely target for price correction during any downward moves, a common market behavior that could further add to short-term bearish pressures.
In summary, Bitcoin has faced short-term selling pressure recently, reflected in declining RSI and MFI values, bearish MACD readings, and fluctuating volume. Nonetheless, modest recovery attempts and moving average trends suggest that the market has not fully turned bearish but is instead in a neutral to mildly bearish phase. Surpassing resistance near 106,000 could pave the way for further gains, while dropping below support near 103,000 would be a negative development.
At present, the market is characterized by caution and uncertainty. Investors are advised to avoid hasty decisions and carefully consider both technical signals and fundamental factors before making moves in this environment.
—
Let me know if you would like it tailored further or formatted differently!
Data Summary
- 1. Time:
2025-06-25 – 00:00 UTC - 2. Prices:
Open: 105333.94000000High: 106290.00000000Low: 104622.02000000Close: 106083.00000000
- 3. Last 5 days’ closing prices:
2025-06-20: 103297.990000002025-06-21: 102120.010000002025-06-22: 100963.870000002025-06-23: 105333.930000002025-06-24: 106083.00000000
- 4. Volume:
BTC: 14651.6934USD: $1543451113.4564
- 5. Number of trades:
2973481
- 6. Indicators:
RSI: 57.6100MFI: 32.5100BB Upper: 110017.53000000BB Lower: 100687.19000000MACD: -220.86000000Signal: 47.56000000Histogram: -268.41000000
- 7. Moving Averages:
SMA:7=103906.3100000014=105005.8500000021=105352.3600000030=105653.3100000050=105273.69000000100=96087.27000000200=96024.40000000EMA:
7=104428.2900000014=104783.9800000021=104967.5300000030=104743.0700000050=103223.21000000100=99427.21000000200=93581.86000000HMA:
7=105068.1600000014=102907.2100000021=102899.4800000030=104044.9100000050=104922.51000000100=110633.82000000200=104530.79000000 - 8. Supports:
S1: 103985.48000000 – 103105.09000000S2: 101508.68000000 – 99950.77000000S3: 96945.63000000 – 90056.17000000S4: 87325.6 – 86310
- 9. Resistances:
R1: 106133.74000000 – 108891.91000000R2: 110274.39000000 – 110797.38000000
- 10. Psychological Support:
100000.00000000
- 11. Psychological Resistance:
110000.00000000
- 12. Funding Rate:
0.0004% (Technically Positive)
- 13. Open Interest:
72609.4660
- 14. Fear & Greed Index:
65 (Greed)
Disclaimer: This market analysis is generated by AI based on historical BTC data and sentiment indicators. Use it as a reference, not financial advice.
