
Disclaimer: This market analysis is generated by AI based on historical BTC data and sentiment indicators. Use it as a reference, not financial advice.
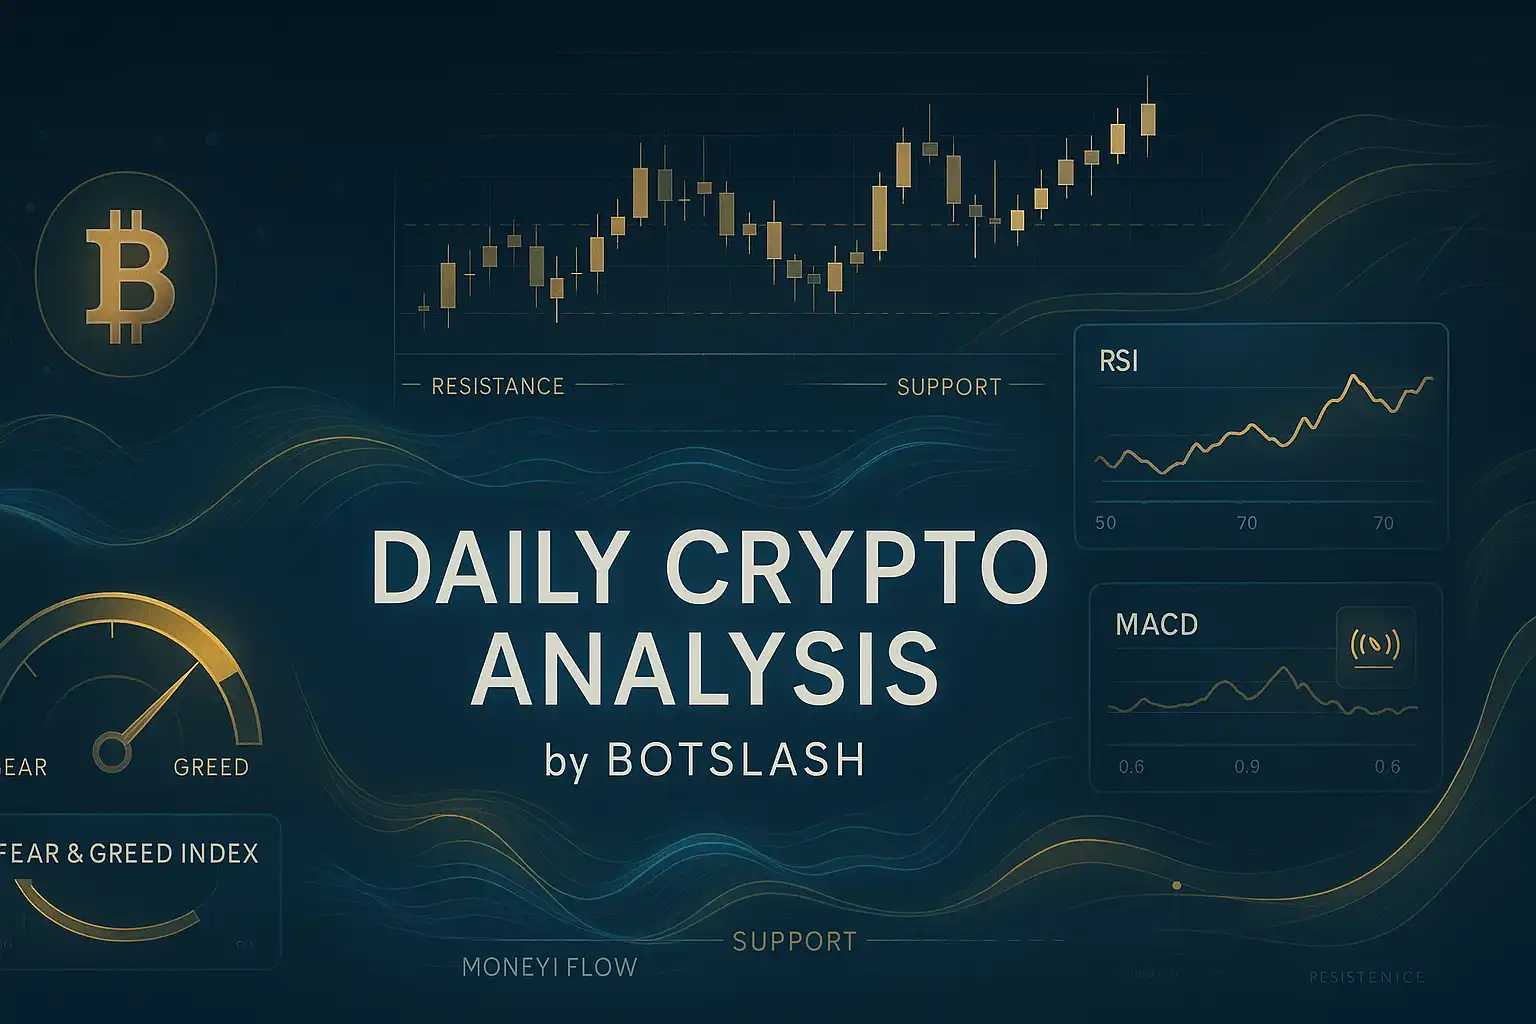
Market Analysis
Over the past five days, Bitcoin’s price has experienced a complex yet moderate downward pressure. Between May 27 and May 31, 2025, the price fluctuated between 110,718 and 103,068, establishing a solid baseline near the psychological support zone of 101,000 to 98,000. The Relative Strength Index (RSI) declined noticeably from 61.37 to 39.61, indicating a shift from strong buying momentum in the early period to weakening conditions in the medium term. Similarly, the Money Flow Index (MFI) dropped from 54.33 to 47.95, entering a neutral zone, suggesting a slight reduction in market liquidity and possible profit-taking. The Moving Average Convergence Divergence (MACD) also showed a steady decline, falling from 3,639 to 2,180, confirming bearish momentum in the short term. Trading volume and the number of trades have been volatile as well; notably, on May 30, volume peaked at 23,706, reflecting intensified selling pressure during the price dip. Meanwhile, the Fear and Greed Index fell from 74 to 50, signaling a shift in market sentiment from near-extreme greed early on to a more balanced emotional state, which contributed to short-term selling pressure followed by moderation.
From a technical standpoint, Bitcoin’s price appears stable near the 101,000 to 98,000 psychological support zone, which acts as a strong base unlikely to break without significant negative news. The support levels are structured hierarchically with S1 ranging between 103,985 and 103,105, S2 between 96,945 and 90,056, and S3 between 84,474 and 83,949. Should one support level fail, the next is positioned to provide reinforcement. On the resistance side, the key psychological barrier is around 110,000, with an important range between 104,722 and 106,850. Particularly, the 110,000 to 113,000 range contains a liquidity cluster that is currently limiting upward movement. Bollinger Bands indicate consolidation near the middle band, accompanied by contraction rather than expansion of the bands—this suggests reduced volatility and a potential reversal. Examining moving averages, the 7- and 14-day Hull Moving Averages (HMA) have declined, signaling short-term selling pressure, while the 21- and 30-day HMAs remain relatively stable, supporting a longer-term bullish trend.
On the fundamental front, recent days have seen increased market uncertainty driven by escalating U.S.-China trade tensions. Notably, U.S. courts’ opposition to former President Trump’s tariffs and complexities in global trade relations have instilled caution among investors, contributing to Bitcoin’s price decline. However, institutional investment efforts, such as those by the Trump Media & Technology Group, and the introduction of crypto-linked credit cards in Thailand, present positive signals pointing toward long-term market stability. The decline in the Fear and Greed Index, a slight positive shift in funding rates, and a reduction in open interest reveal that some investors are taking profits in the short term, though overall bullish sentiment remains intact. Additionally, Bitcoin’s brief surge above 111,000 followed by a return to the range reflects a mixed neutral-to-bearish market dynamic, with investors adopting a cautious stance ahead of the next significant move.
In summary, Bitcoin’s price is currently navigating a complex but stable range from both technical and fundamental perspectives. The psychological support zone between 101,000 and 98,000 remains robust, making a breakdown unlikely without major negative developments, while resistance between 110,000 and 113,000 is effectively capping upward momentum. RSI and MFI readings point toward market weakness but stop short of signaling a full bearish reversal, and the MACD’s decline confirms short-term pressure. Global trade tensions and judicial rulings have heightened investor caution, yet ongoing institutional interest and technical stability underpin a long-term bullish outlook. Consequently, Bitcoin’s price is exhibiting a neutral to mixed bearish trend within the current range, with expected short-term volatility balanced by prospects for long-term stability and potential breakout. Investors are advised to closely monitor key support and resistance levels while staying informed on evolving global economic and political developments.
Data Summary
- 2. Prices:
Open: 103985.47000000High: 104900.00000000Low: 103068.55000000Close: 104591.88000000
- 3. Last 5 days’ closing prices:
2025-05-27: 108938.170000002025-05-28: 107781.780000002025-05-29: 105589.750000002025-05-30: 103985.480000002025-05-31: 104591.88000000
- 4. Volume:
BTC: 11289.3592USD: $1174000801.5070
- 5. Number of trades:
2343787
- 6. Indicators:
RSI: 39.6100MFI: 47.9500BB Upper: 111204.94000000BB Lower: 101128.35000000MACD: 2180.01000000Signal: 3140.26000000Histogram: -960.25000000
- 7. Moving Averages:
SMA:7=107046.5800000014=107473.1700000021=106166.6500000030=103872.0700000050=98174.41000000100=91673.37000000200=94745.61000000EMA:
7=106176.3200000014=106172.7500000021=105116.1200000030=103365.9800000050=100004.81000000100=95803.74000000200=90389.98000000HMA:
7=103202.7400000014=105800.8600000021=107731.4300000030=109255.6100000050=110879.17000000100=108402.94000000200=94762.98000000 - 8. Supports:
S1: 103985.48000000 – 103105.09000000S2: 96945.63000000 – 90056.17000000S3: 84474.69000000 – 83949.52000000
- 9. Resistances:
R1: 104722.94000000 – 106850.00000000
- 10. Psychological Support:
100000.00000000
- 11. Psychological Resistance:
110000.00000000
- 12. Funding Rate:
0.0047%
- 13. Open Interest:
82415.9540
- 14. Fear & Greed Index:
50 (Neutral)
